

Pages
Rotating Bargraph
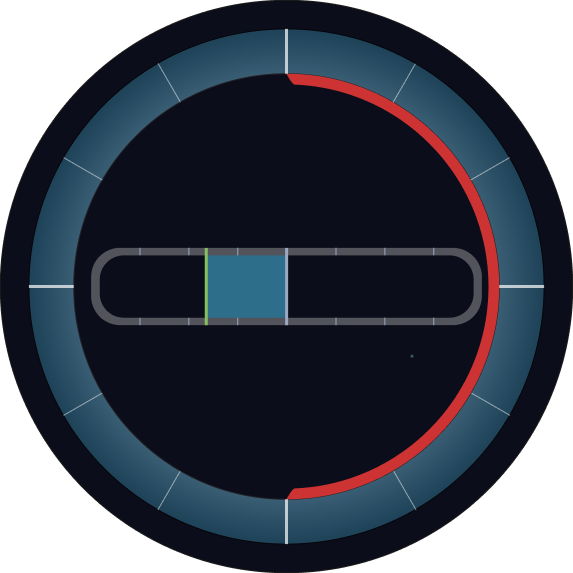
The Rotating Bargraph control is a dynamic visualization widget that combines the features of a standard bargraph with rotational capabilities. In addition to displaying a value with a traditional bar, it includes a rotateGroup element that can rotate based on the current value—making it ideal for applications like compass displays, azimuth indicators, or ship instrumentation.
Overview
Just like the standard Custom Bargraph, the Rotating Bargraph displays real-time data through a fillable bar, optionally including numeric values, units, and thresholds. The added rotation feature allows visualizing directional or angular data, adding another layer of contextual feedback for the operator.
Key Features
Rotating Visualization
- Includes a
rotateGroupSVG element that rotates based on the live value. - Ideal for angular data like compass headings, wind directions, or radar beams.
Bargraph Functionality
- Displays a horizontal or vertical bar that fills relative to the current value.
- Includes support for thresholds, alarms, and intermediate markers.
Real-Time Variable Binding
- Connect to data sources like CODESYS or MQTT for continuous updates.
- Both the bar and rotation respond to the same or different bound values.
Numerical Value & Unit Display
- Optionally show the current value and unit (e.g., °, N, RPM).
- Provides clarity alongside visual indicators.
Custom Labels & Appearance
- Add labels, styling, and customize color themes to match your interface.
- Supports both metric and symbolic information.
Use Cases
Navigation Instruments
- Example: Display ship heading, rudder angle, or wind direction.
Industrial Monitoring
- Example: Show rotary positions of mechanical components, such as valves or turntables.
Orientation Feedback
- Example: Visualize angular feedback from sensors like gyroscopes or compasses.
SVG ID Reference Table
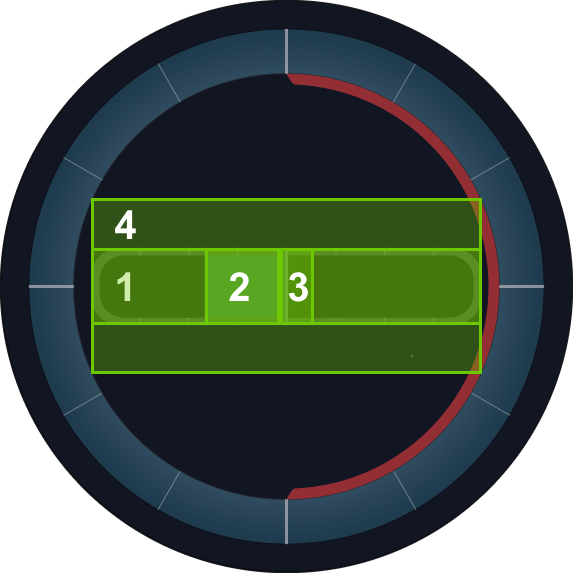
Use the following SVG IDs to map values to elements in the Rotating Bargraph:
| # | Element | SVG ID |
|---|---|---|
| 1 | Bar Path | barPath |
| 2 | Bar Fill | barLFill |
| 3 | Thumb | thumb |
| 4 | Rotational Origin | rotateGroup |
Code Snippet Example
<g id="rotateGroup">
    <g id="barPathArea">
      <path class="cls-7" d="M790.25,432.42H209.11a50.72,50.72,0,0,0-50.72,50.72v33.6a50.72,50.72,0,0,0,50.72,50.72H790.25A50.72,50.72,0,0,0,841,516.74v-33.6A50.72,50.72,0,0,0,790.25,432.42Zm36.29,79.89a42.16,42.16,0,0,1-42.16,42.16H215.62a42.16,42.16,0,0,1-42.16-42.16V487.79a42.16,42.16,0,0,1,42.16-42.16H784.38a42.16,42.16,0,0,1,42.16,42.16Z" transform="translate(0.82 0.52)"/>
      <line class="cls-8" x1="330.01" y1="432.84" x2="330.01" y2="446.15"/>
      <line class="cls-8" x1="415.42" y1="432.83" x2="415.42" y2="446.14"/>
      <line class="cls-8" x1="244.61" y1="432.83" x2="244.61" y2="446.14"/>
      <line class="cls-8" x1="330.01" y1="555" x2="330.01" y2="568.15"/>
      <line class="cls-8" x1="415.42" y1="554.99" x2="415.42" y2="568.14"/>
      <line class="cls-8" x1="244.61" y1="554.99" x2="244.61" y2="568.14"/>
      <line class="cls-8" x1="672.38" y1="432.81" x2="672.38" y2="446.12"/>
      <line class="cls-8" x1="757.78" y1="432.8" x2="757.78" y2="446.11"/>
      <line class="cls-8" x1="586.98" y1="432.8" x2="586.98" y2="446.11"/>
      <line class="cls-8" x1="672.38" y1="554.97" x2="672.38" y2="568.12"/>
      <line class="cls-8" x1="757.78" y1="554.96" x2="757.78" y2="568.11"/>
      <line class="cls-8" x1="586.98" y1="554.96" x2="586.98" y2="568.11"/>
    </g>
    <g id="barLFillArea">
      <rect id="barLFill" class="cls-9" x="360.31" y="446.15" width="140.19" height="108.84"/>
      <line class="cls-10" x1="360.31" y1="432.94" x2="360.31" y2="568.2"/>
    </g>
    <rect id="barPath" class="cls-12" x="208.49" y="446.11" width="584.84" height="106.58"/>
    <line id="thumb" class="cls-11" x1="500.82" y1="432.94" x2="500.82" y2="568.2"/>
  </g> ```