

Pages
Drehbares Balkendiagramm(Rotating Bargraph)
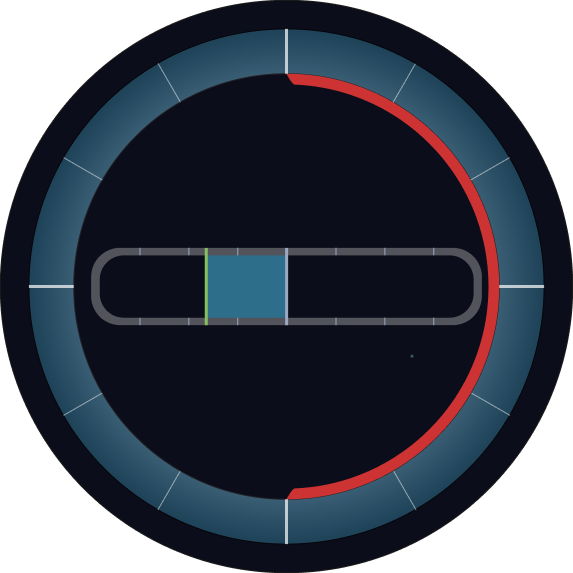
Das Rotating Bargraph ist ein dynamisches Anzeige-Widget, das die Eigenschaften eines herkömmlichen Balkendiagramms mit einer Rotationsfunktion kombiniert.
Neben der Darstellung eines Werts über einen Balken enthält es ein rotateGroup-Element, das sich entsprechend dem aktuellen Wert dreht – ideal für Anwendungen wie Kompassanzeigen, Azimut-Indikatoren oder Schiffsinstrumente.
Übersicht
Wie das klassische Custom Bargraph zeigt das Rotating Bargraph Echtzeitdaten in Form eines Balkens, ergänzt um Werte, Einheiten und Schwellen.
Durch die zusätzliche Rotationsfunktion können Winkel- oder Richtungswerte anschaulich visualisiert werden.
Hauptfunktionen
Rotierende Darstellung
- Enthält ein
rotateGroup-SVG-Element, das sich entsprechend dem Live-Wert dreht - Optimal für Richtungsdaten wie Kompasskurs, Windrichtung oder Radarwinkel
Balkenanzeige
- Zeigt einen horizontalen oder vertikalen Balken entsprechend des aktuellen Werts
- Unterstützt Schwellenwerte, Alarme und Zwischenmarkierungen
Live-Datenbindung
- Anbindung an Datenquellen wie CODESYS oder MQTT
- Rotation und Balken können an denselben oder verschiedene Variablen gebunden werden
Numerische Anzeige & Einheit
- Optionale Anzeige des aktuellen Werts mit Einheit (z. B. °, N, RPM)
- Ergänzt visuelle Darstellung um exakte Zahleninformation
Benutzerdefinierte Gestaltung
- Farbschema, Beschriftungen und Stil vollständig anpassbar
- Unterstützt metrische und symbolische Daten gleichermaßen
Einsatzszenarien
Navigationsanzeigen
- Beispiel: Anzeige von Kursrichtung, Ruderlage oder Windrichtung
Industrielle Überwachung
- Beispiel: Anzeige von Drehpositionen mechanischer Bauteile wie Ventile oder Drehteller
Orientierungsrückmeldung
- Beispiel: Winkelrückmeldung aus Gyroskopen oder Kompasssensoren visualisieren
SVG ID Referenztabelle
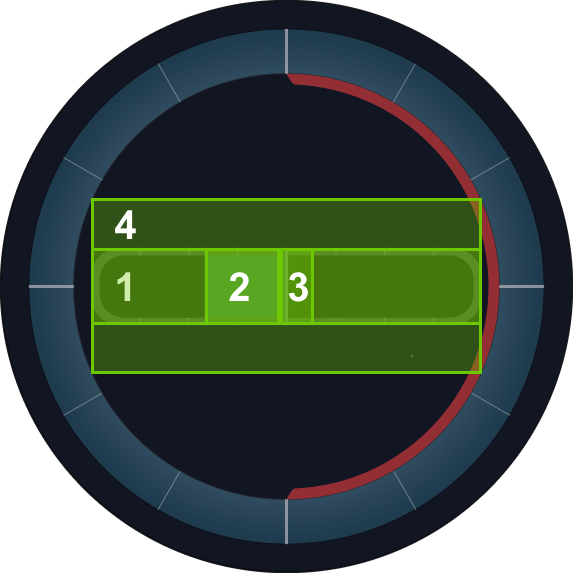
Nutze die folgenden SVG-IDs zur Zuordnung von Variablen im Rotating Bargraph:
| # | Element | SVG ID |
|---|---|---|
| 1 | Balkenpfad | barPath |
| 2 | Balkenfüllung | barLFill |
| 3 | Thumb / Zeiger | thumb |
| 4 | Rotationsursprung (Gruppe) | rotateGroup |
Codebeispiel(Code Snippet Example)
<g id="rotateGroup">
    <g id="barPathArea">
      <path class="cls-7" d="M790.25,432.42H209.11a50.72,50.72,0,0,0-50.72,50.72v33.6a50.72,50.72,0,0,0,50.72,50.72H790.25A50.72,50.72,0,0,0,841,516.74v-33.6A50.72,50.72,0,0,0,790.25,432.42Zm36.29,79.89a42.16,42.16,0,0,1-42.16,42.16H215.62a42.16,42.16,0,0,1-42.16-42.16V487.79a42.16,42.16,0,0,1,42.16-42.16H784.38a42.16,42.16,0,0,1,42.16,42.16Z" transform="translate(0.82 0.52)"/>
      <line class="cls-8" x1="330.01" y1="432.84" x2="330.01" y2="446.15"/>
      <line class="cls-8" x1="415.42" y1="432.83" x2="415.42" y2="446.14"/>
      <line class="cls-8" x1="244.61" y1="432.83" x2="244.61" y2="446.14"/>
      <line class="cls-8" x1="330.01" y1="555" x2="330.01" y2="568.15"/>
      <line class="cls-8" x1="415.42" y1="554.99" x2="415.42" y2="568.14"/>
      <line class="cls-8" x1="244.61" y1="554.99" x2="244.61" y2="568.14"/>
      <line class="cls-8" x1="672.38" y1="432.81" x2="672.38" y2="446.12"/>
      <line class="cls-8" x1="757.78" y1="432.8" x2="757.78" y2="446.11"/>
      <line class="cls-8" x1="586.98" y1="432.8" x2="586.98" y2="446.11"/>
      <line class="cls-8" x1="672.38" y1="554.97" x2="672.38" y2="568.12"/>
      <line class="cls-8" x1="757.78" y1="554.96" x2="757.78" y2="568.11"/>
      <line class="cls-8" x1="586.98" y1="554.96" x2="586.98" y2="568.11"/>
    </g>
    <g id="barLFillArea">
      <rect id="barLFill" class="cls-9" x="360.31" y="446.15" width="140.19" height="108.84"/>
      <line class="cls-10" x1="360.31" y1="432.94" x2="360.31" y2="568.2"/>
    </g>
    <rect id="barPath" class="cls-12" x="208.49" y="446.11" width="584.84" height="106.58"/>
    <line id="thumb" class="cls-11" x1="500.82" y1="432.94" x2="500.82" y2="568.2"/>
  </g> ```
<g id="rotateGroup">
<g id="barPathArea">
<path class="cls-7" d="M790.25,432.42H209.11a50.72,50.72,0,0,0-50.72,50.72v33.6a50.72,50.72,0,0,0,50.72,50.72H790.25A50.72,50.72,0,0,0,841,516.74v-33.6A50.72,50.72,0,0,0,790.25,432.42Zm36.29,79.89a42.16,42.16,0,0,1-42.16,42.16H215.62a42.16,42.16,0,0,1-42.16-42.16V487.79a42.16,42.16,0,0,1,42.16-42.16H784.38a42.16,42.16,0,0,1,42.16,42.16Z" transform="translate(0.82 0.52)"/>
<line class="cls-8" x1="330.01" y1="432.84" x2="330.01" y2="446.15"/>
<line class="cls-8" x1="415.42" y1="432.83" x2="415.42" y2="446.14"/>
<line class="cls-8" x1="244.61" y1="432.83" x2="244.61" y2="446.14"/>
<line class="cls-8" x1="330.01" y1="555" x2="330.01" y2="568.15"/>
<line class="cls-8" x1="415.42" y1="554.99" x2="415.42" y2="568.14"/>
<line class="cls-8" x1="244.61" y1="554.99" x2="244.61" y2="568.14"/>
<line class="cls-8" x1="672.38" y1="432.81" x2="672.38" y2="446.12"/>
<line class="cls-8" x1="757.78" y1="432.8" x2="757.78" y2="446.11"/>
<line class="cls-8" x1="586.98" y1="432.8" x2="586.98" y2="446.11"/>
<line class="cls-8" x1="672.38" y1="554.97" x2="672.38" y2="568.12"/>
<line class="cls-8" x1="757.78" y1="554.96" x2="757.78" y2="568.11"/>
<line class="cls-8" x1="586.98" y1="554.96" x2="586.98" y2="568.11"/>
</g>
<g id="barLFillArea">
<rect id="barLFill" class="cls-9" x="360.31" y="446.15" width="140.19" height="108.84"/>
<line class="cls-10" x1="360.31" y1="432.94" x2="360.31" y2="568.2"/>
</g>
<rect id="barPath" class="cls-12" x="208.49" y="446.11" width="584.84" height="106.58"/>
<line id="thumb" class="cls-11" x1="500.82" y1="432.94" x2="500.82" y2="568.2"/>
</g> ```
rotateGroup
thumb
barLFill
barPath
rotateGroup
rotateGroup