

Pages
Controls: Custom Gauge
The Custom Gauge control is a flexible and visually engaging way to represent numeric values, such as sensor readings or system metrics, in a gauge-style display. This control allows users to upload their own custom SVG graphics for a fully personalized look, while also offering control over the gauge’s scale through configurable angles and ticks.
Overview: How a Custom Gauge Works
Every gauge has three key components that define its appearance and behavior:
- Visual Range (Min / Max) – the number range displayed on the gauge.
- Angular Sweep (Start Angle / End Angle) – the angular section the needle can rotate in.
- Needle Position (Initial Arrow Position) – the default position the needle points to when no value is received.
In the default setup, you can choose from different SVGs (provided or your own), but you must configure these values individually – there is no one-size-fits-all. That’s because each SVG has its own number range, visual layout, and center point.
Always enter numeric values as plain numbers, without any symbols or units.
Example (correct):-30
Example (incorrect):-30°
This applies to: Start Angle, End Angle, Initial Arrow Position, Min, Max, etc.
Step-by-Step Configuration
1. Min / Max *
This defines the data value range shown on the gauge (e.g. 0–400, 0–3000).
- This range is not angular, it refers to the numerical values that appear along the arc.
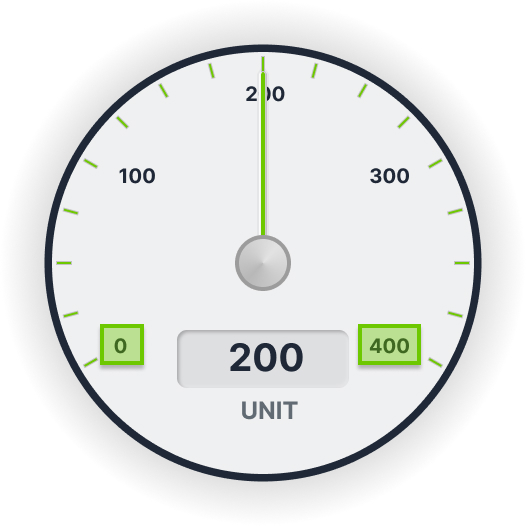
- You can recognize the min/max values visually by looking at the smallest and highest values along the SVG gauge scale.
Example 1:
If the gauge shows values from 0 to 400, then:
Min=0Max=400
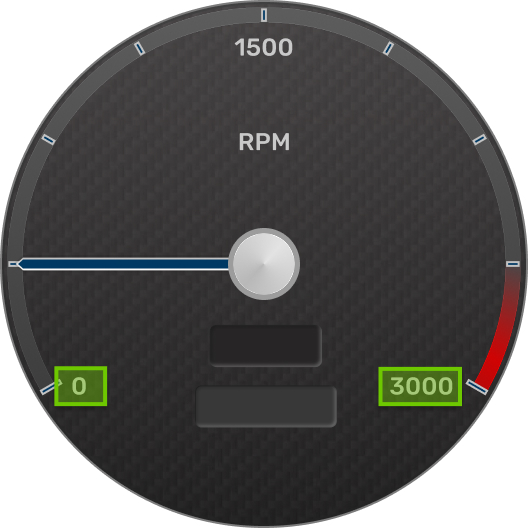
Example 2:
If another gauge shows values from
0to3000, then:Min=0Max=3000
Important: These values must always match the numbers printed along the arc of your selected gauge.
2. Start Angle / End Angle
This defines the rotational range of the needle, relative to the rotation origin.
- Start Angle = position where the needle begins.
- End Angle = position where the needle ends.
- The needle rotates between these two angles.
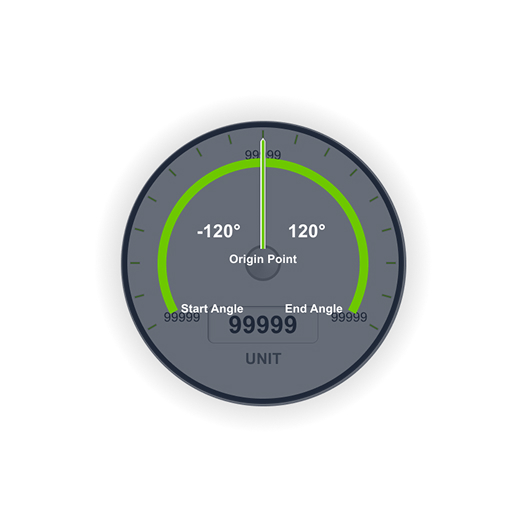
Example (see image below):
Start Angle:-120°End Angle:120°
This gives a sweep of 240°, with the center needle position at0°
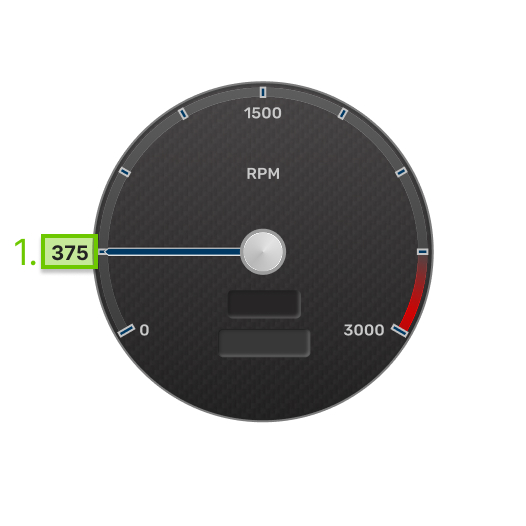
Here is another example (see image below), to also understand some anomalies:
With this Gauge you have your Needle at a diffrent Initial Arrow Position Value (375)
Start Angleis here then:-30°End Angle: is here then:210°
3. Initial Arrow Position Value *
This defines where the needle should be pointing when the SVG is loaded, before live data is received.
- It should correspond to the value on the scale that the needle graphically points to at rest.
- Use the same range as in Min/Max.
Example (see image above):
If the gauge range is 0â3000 and the needle points to the 375 (1500:4) mark at rest:
- Set
Initial Arrow Position Valueto375.
This helps align the needle with the real-world expected "start value".
Why Every Gauge Is Different
Each SVG may use a different scale (e.g. 0–400 vs 0–3000), a different angular sweep (e.g. 180° vs 240°), and a different center point.
That’s why you must configure each one separately in the Custom Gauge Properties.
Remote Configuration Option (CODESYS)
In some setups, you may want to control the gauge parameters remotely – for instance, from CODESYS.
Use this if:
- You want to change angles or limits dynamically from PLC logic.
- You want to maintain centralized control over gauge behavior.
You can enable Remote Control in the gauge properties. This will let you bind parameters such as min, max, angles, etc., to variables.
Example: Configuration
PROGRAM PLC_PRG
VAR
            CustomGauge1                                             : plcvisu.CustomGauge;
END_VAR


            CustomGauge1.value                                                       := REAL_TO_STRING(55);
            CustomGauge1.parameters.pMin                                     := -50;
            CustomGauge1.parameters.pMax                                    := 50;
            CustomGauge1.parameters.startAngle                             := -120;
            CustomGauge1.parameters.endAngle                              := 120;
            CustomGauge1.parameters.initialArrowPositionValue        := 0;
            CustomGauge1.ticks[0]                                                     := '-50';
            CustomGauge1.ticks[2]                                                     := '0';
            CustomGauge1.ticks[1]                                                     := '50';
            CustomGauge1.unit                                                          := 'unit';
Uploading Your Own SVGs (Advanced Users)
Once you’ve mastered the default configuration, you can upload your own SVGs.
Go to the SVG ID Reference Table below to structure your SVG properly. These IDs must be assigned in your SVG editor to ensure compatibility.
SVG ID Reference Table
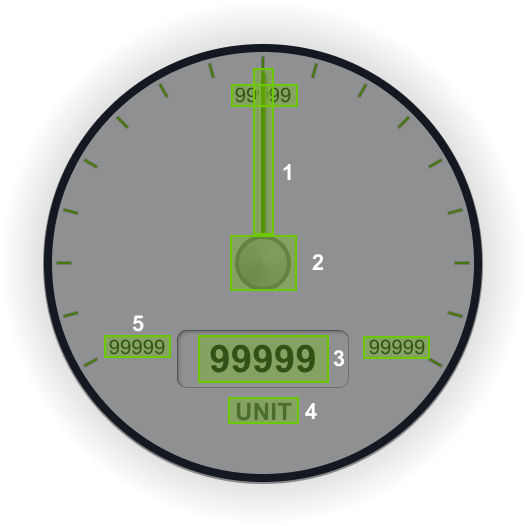
| # | Element | SVG ID |
|---|---|---|
| 1 | Needle / Arrow / Indicator | arrow |
| 2 | Origin for Needle Rotation | rotationPoint |
| 3 | Current Value | value_tspan |
| 4 | Unit | label_unit_tspan |
| 5 | Major Tick (Can be as many as needed ) | tick_major_1_value |
| 6 | Root Class | custom_control_root |
Setup
The custom gauge is highly customizable, but needs proper setup in order to work smoothly.
The gauges' needle defines it's rotational origin point. The start angle and end angle of the gauge depend on the needle's orgin point. In the image below you can see that the start angle should be -120° relative to the needle. The same logic goes for the end angle. Keep this in mind when designing your custom gauge.
Custom Gauge Configuration
The custom gauge component offers a high degree of flexibility but requires careful configuration to function correctly.
The needle's rotation origin is a critical parameter that determines the gauge’s behavior. Specifically, the startAngle and endAngle properties are defined relative to the needle’s origin point. For example, if the needle’s origin is positioned like in the image below, the startAngle will be -120°, with the corresponding endAngle adjusted accordingly, in this case 120°
Note: Always consider the needle's origin point when defining angle ranges to ensure smooth and accurate rendering of the gauge.