
Showcases General
Chart
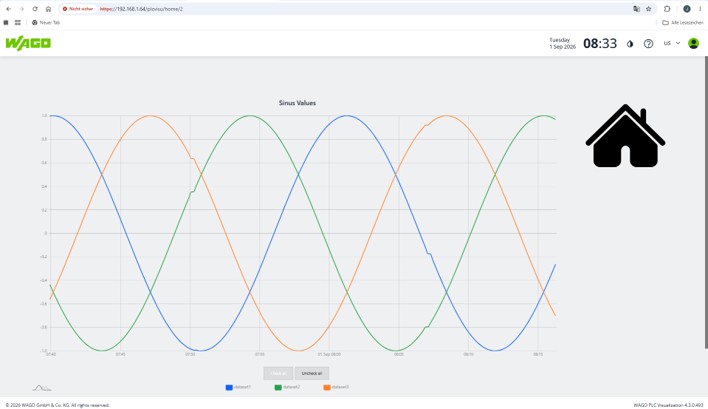
WIth Chart you can show data as
- static datas, this are fixed datas you enter manually.
- datalogger, this are historical datas and store in a SQlite database.
- dynamic, this are dynamic datas direct from CODESYS
Prerequisites
- WP400: install PLCVisu on the device and use it as an Visualization Panel
- PFC300: Install CODESYS and PLCVisu
- CC100: Install CODESYS and PLCVisu
Chart with fixed datas
Please follow the steps:
-
Charts - NEW
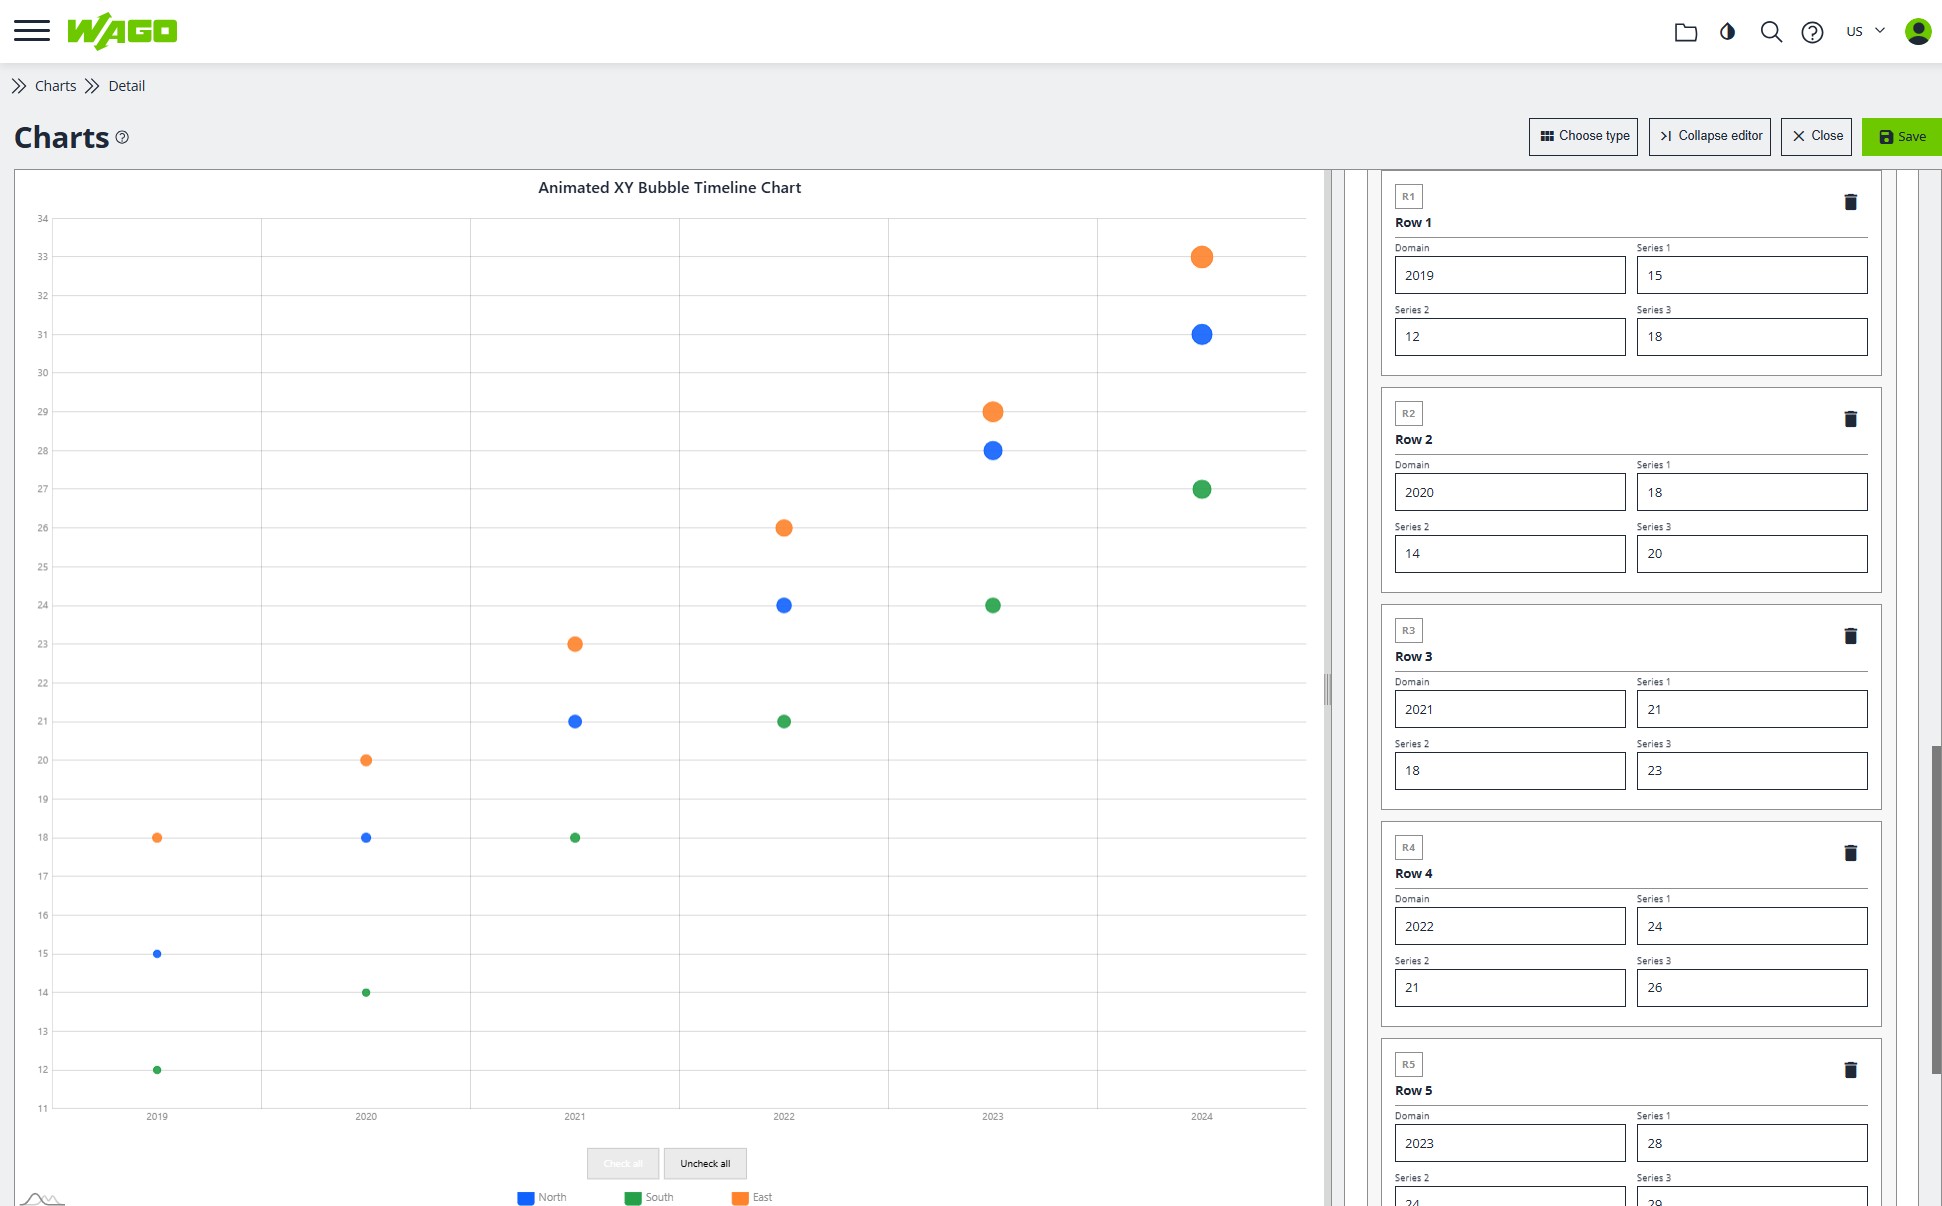
Choose the Bubble Timeline Chart -
Data connection to Static Data end enter the values manualy
-
Bring the Chart object on the visu screen
-
see the Chart in RUN mode
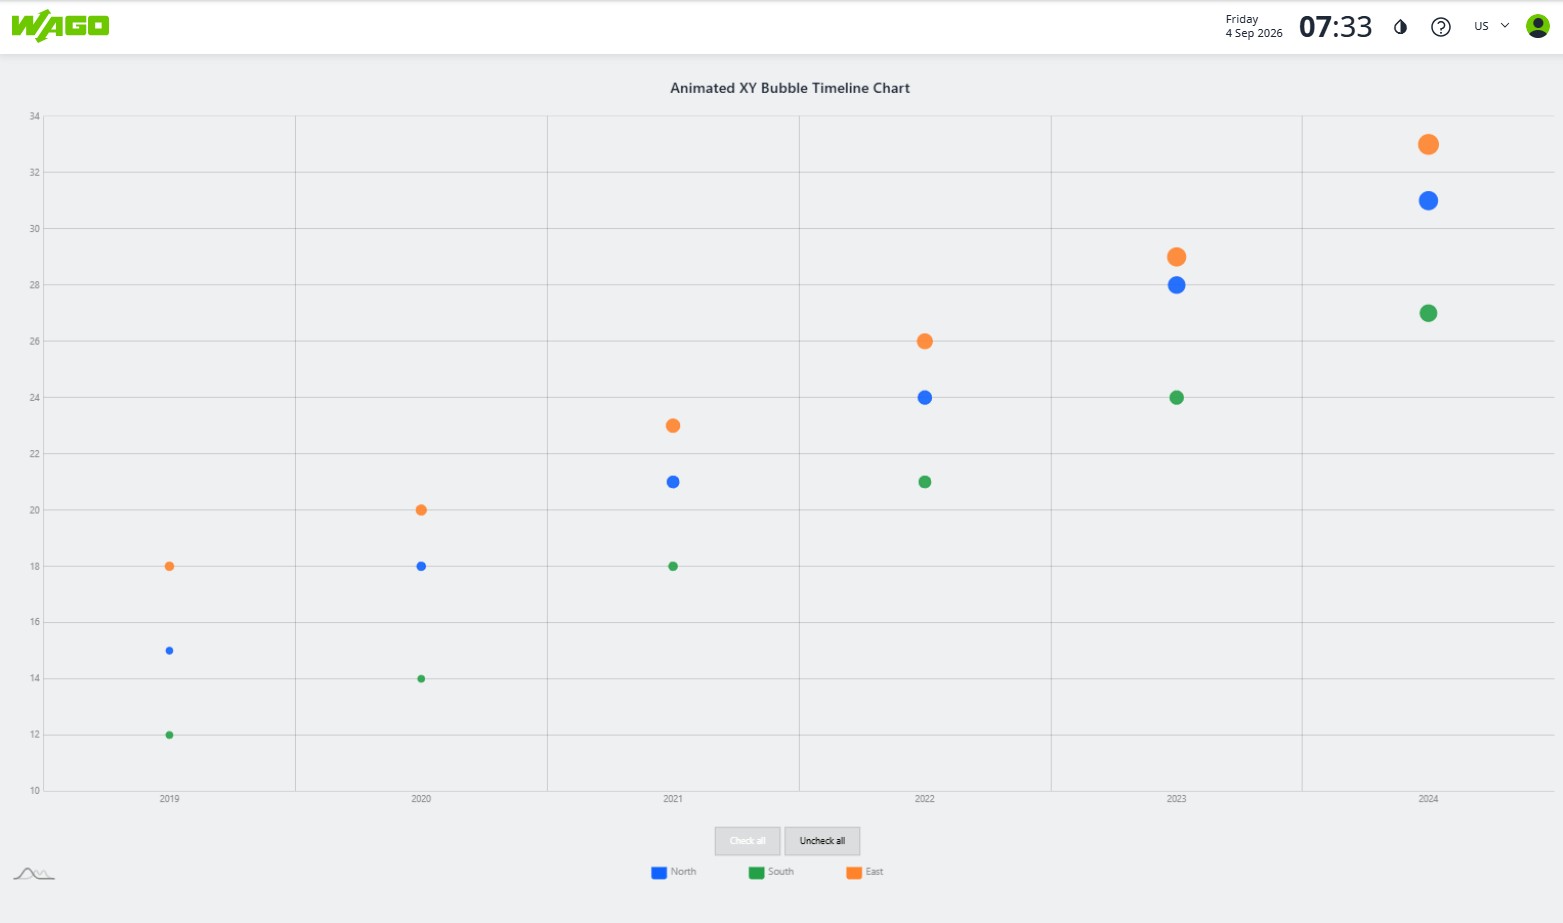
Chart with historical datas
Please follow the steps:
-
Data connection to datalogger
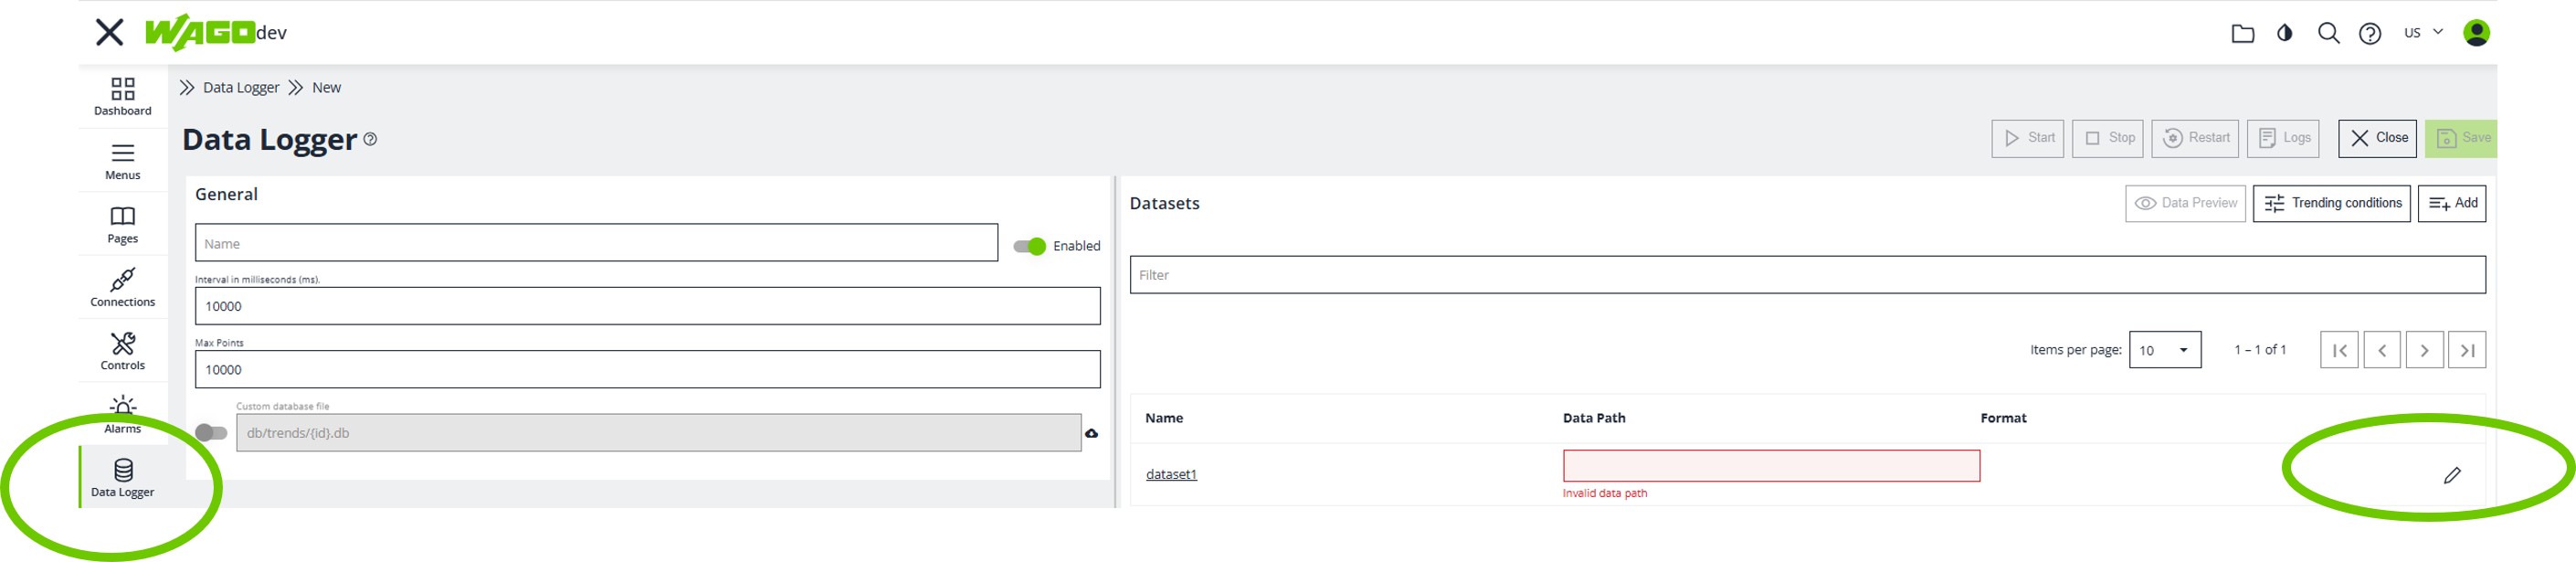
With the max datapoints you setup the FIFO register. If the interval is 1000ms,
max datapoints = 60 x 60 x 24 x 365 = 3153600 contains 1 years data.
You can choose an custom database file on any location e.g. SD-card.
Otherwise it will be stored on the internal flash.
CAUTION : be aware of the free disk space. -
select the dataset setup and add as many datapoints you want
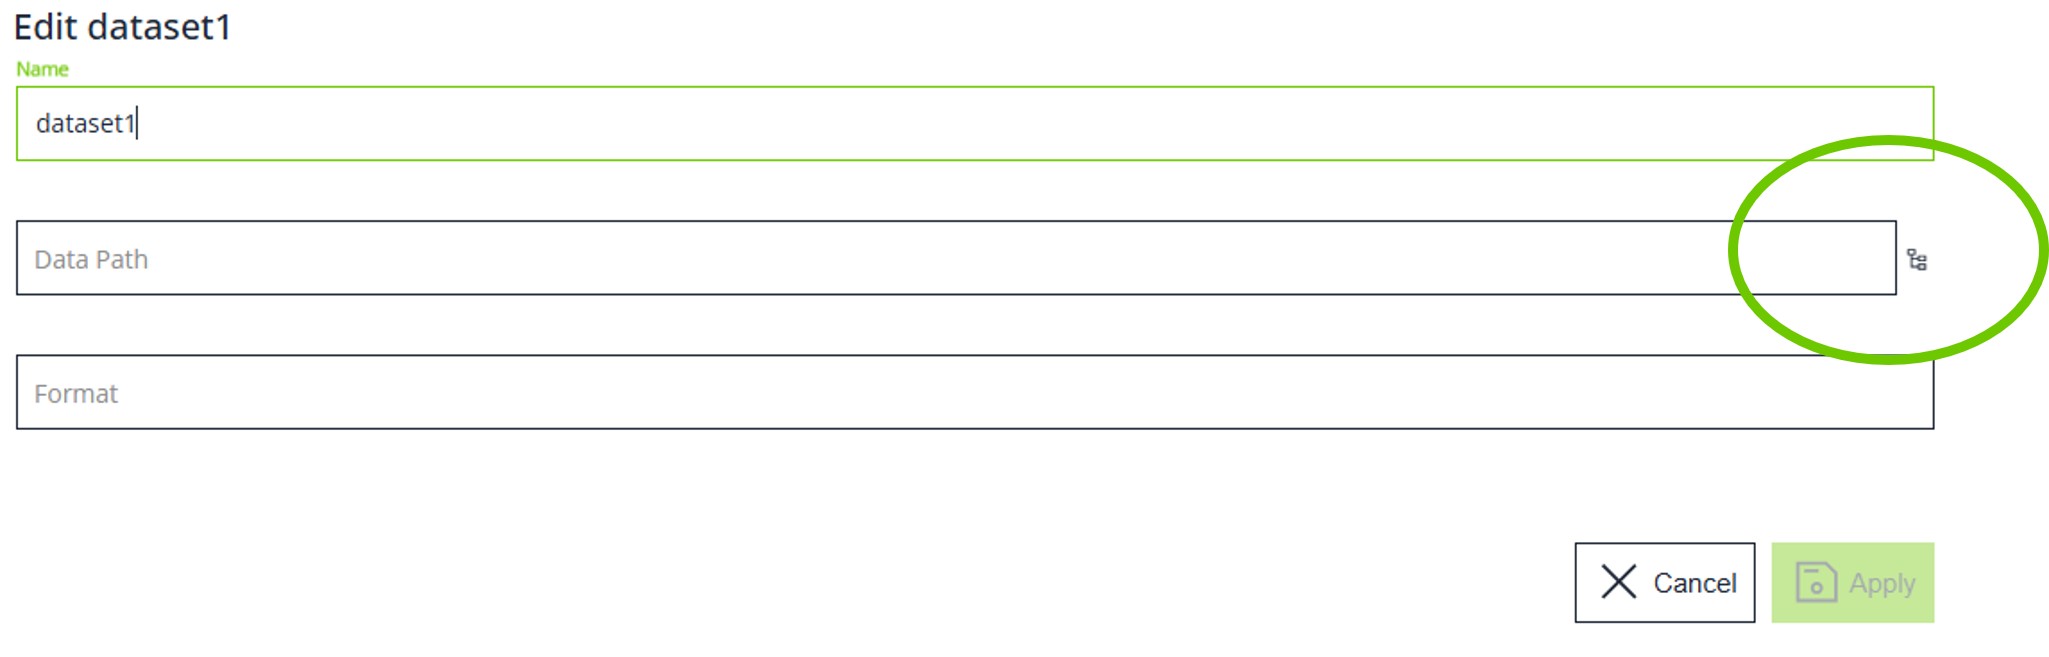
-
select the datapoint from the Data Tree Picker
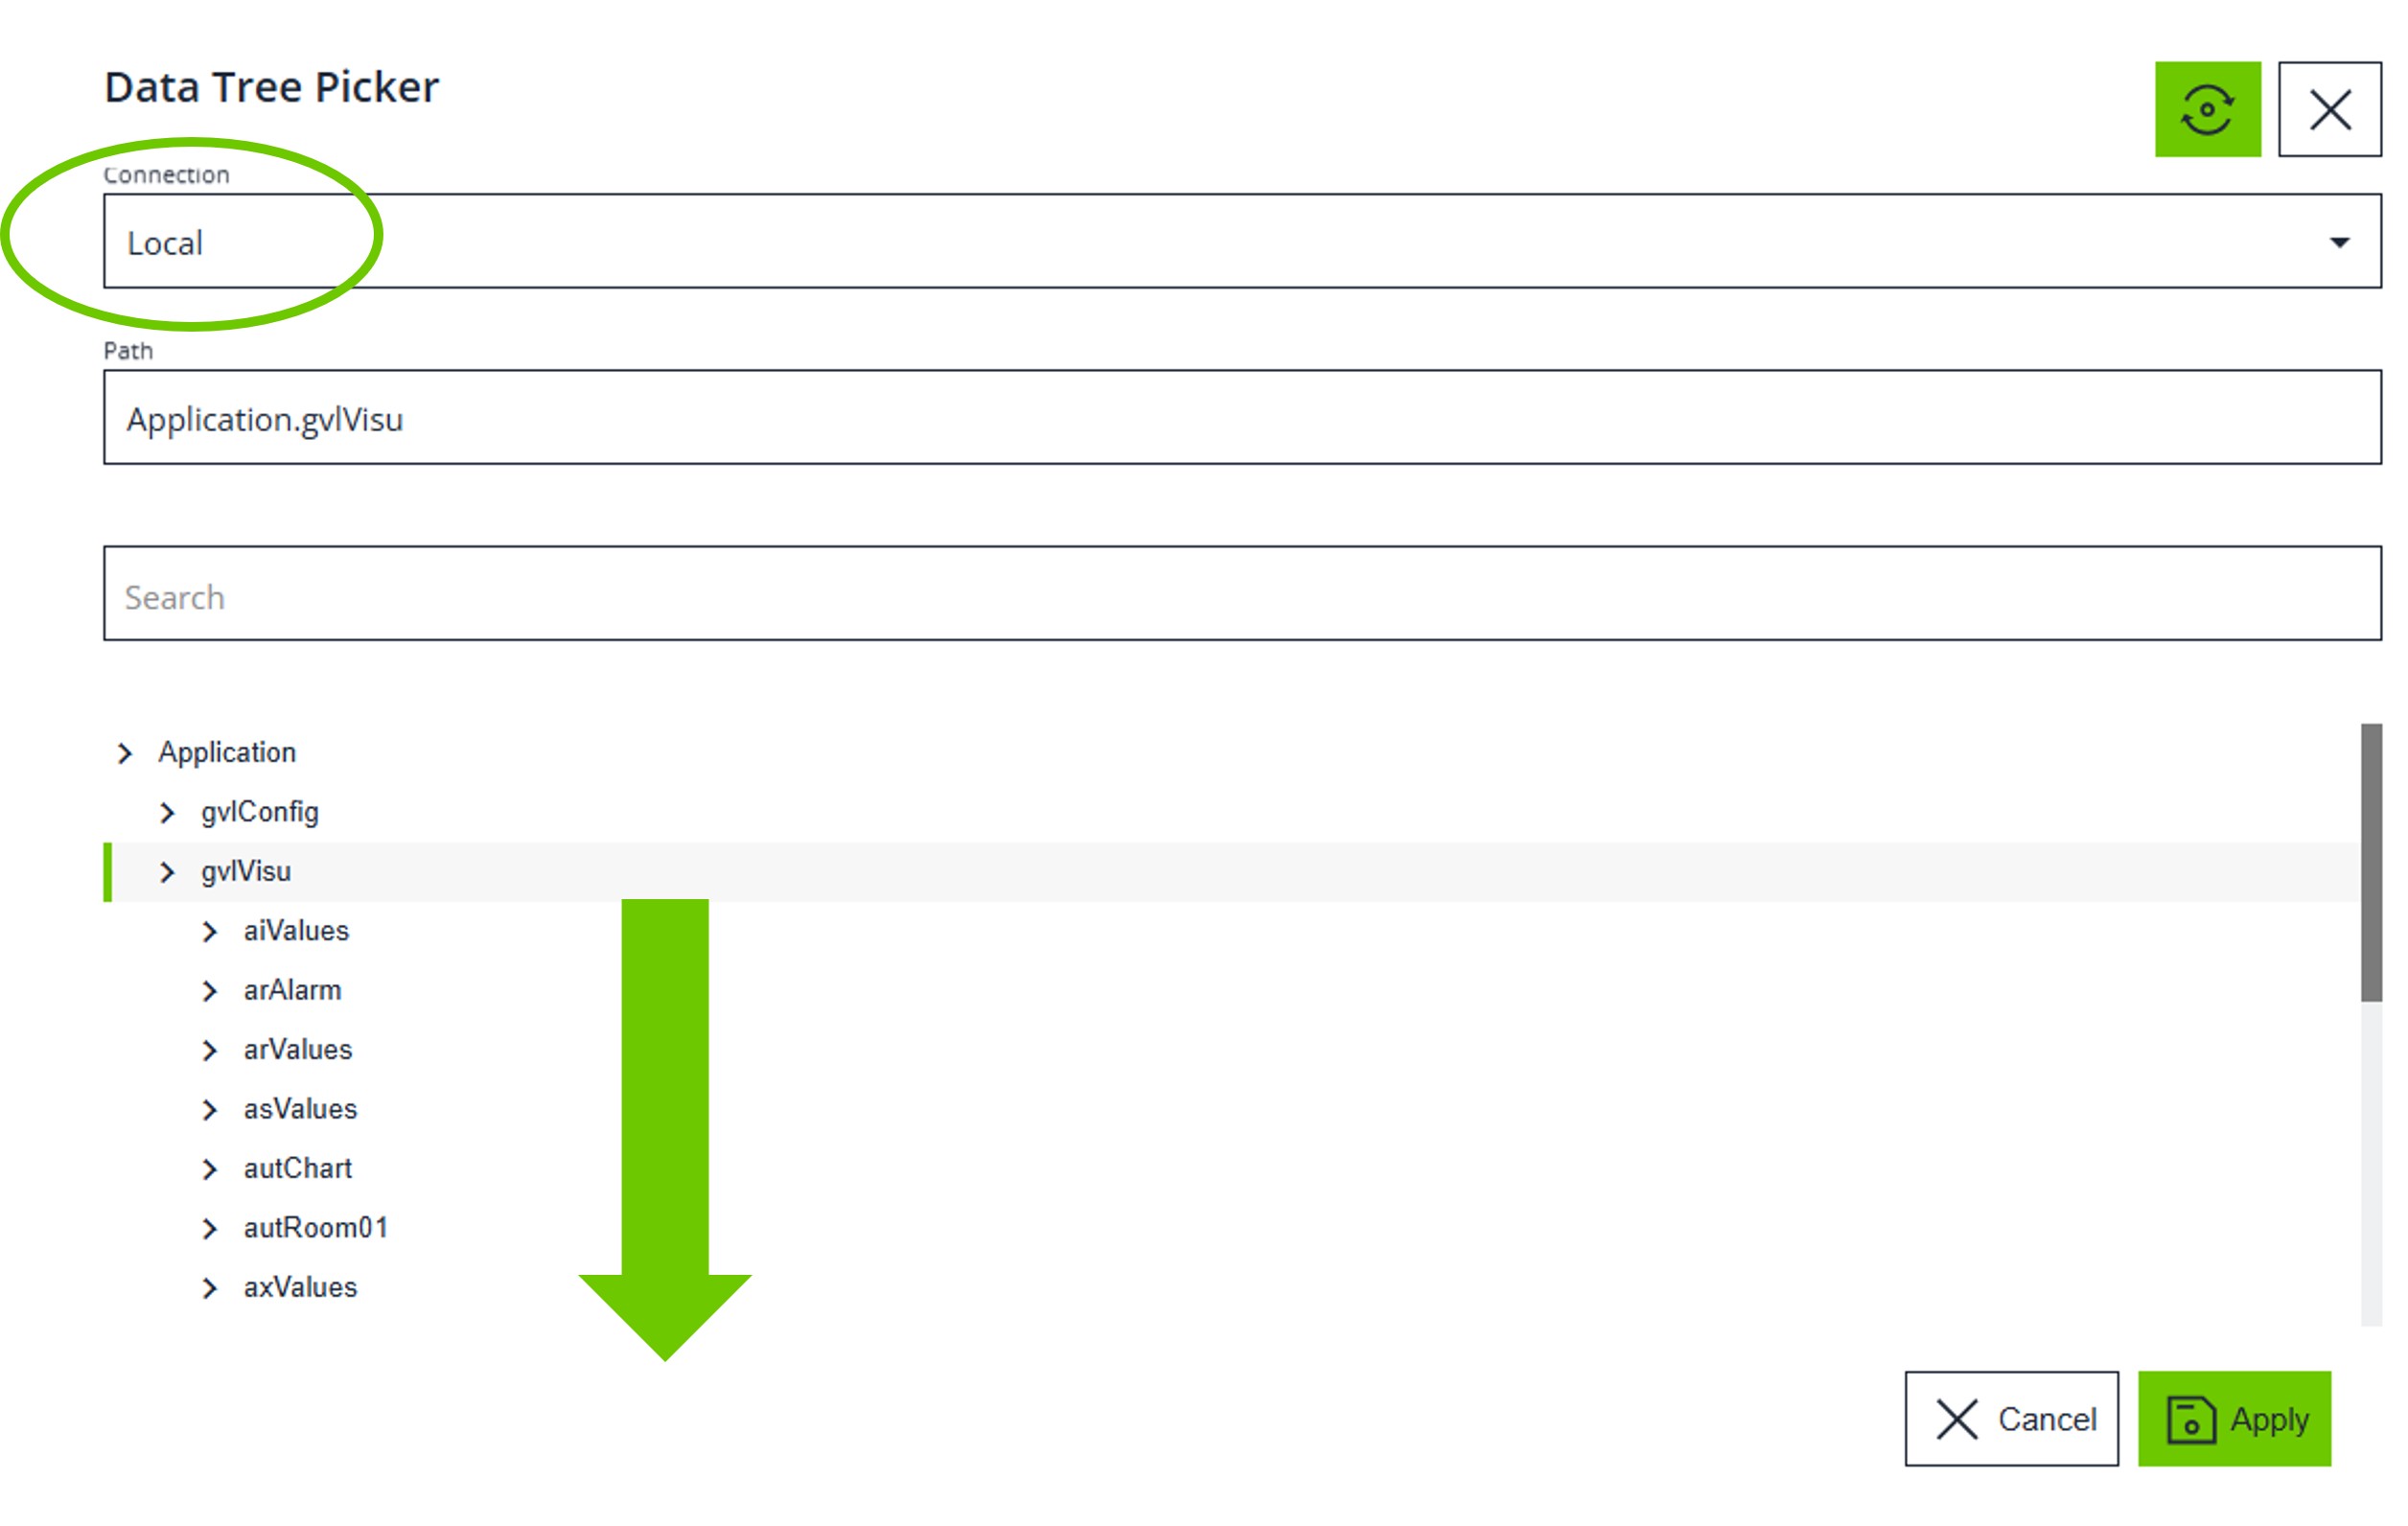
and save. -
The datalogger starts automatic and records the datapoints every presetet interval time e.g. 1000ms. With the Button "Data Preview"
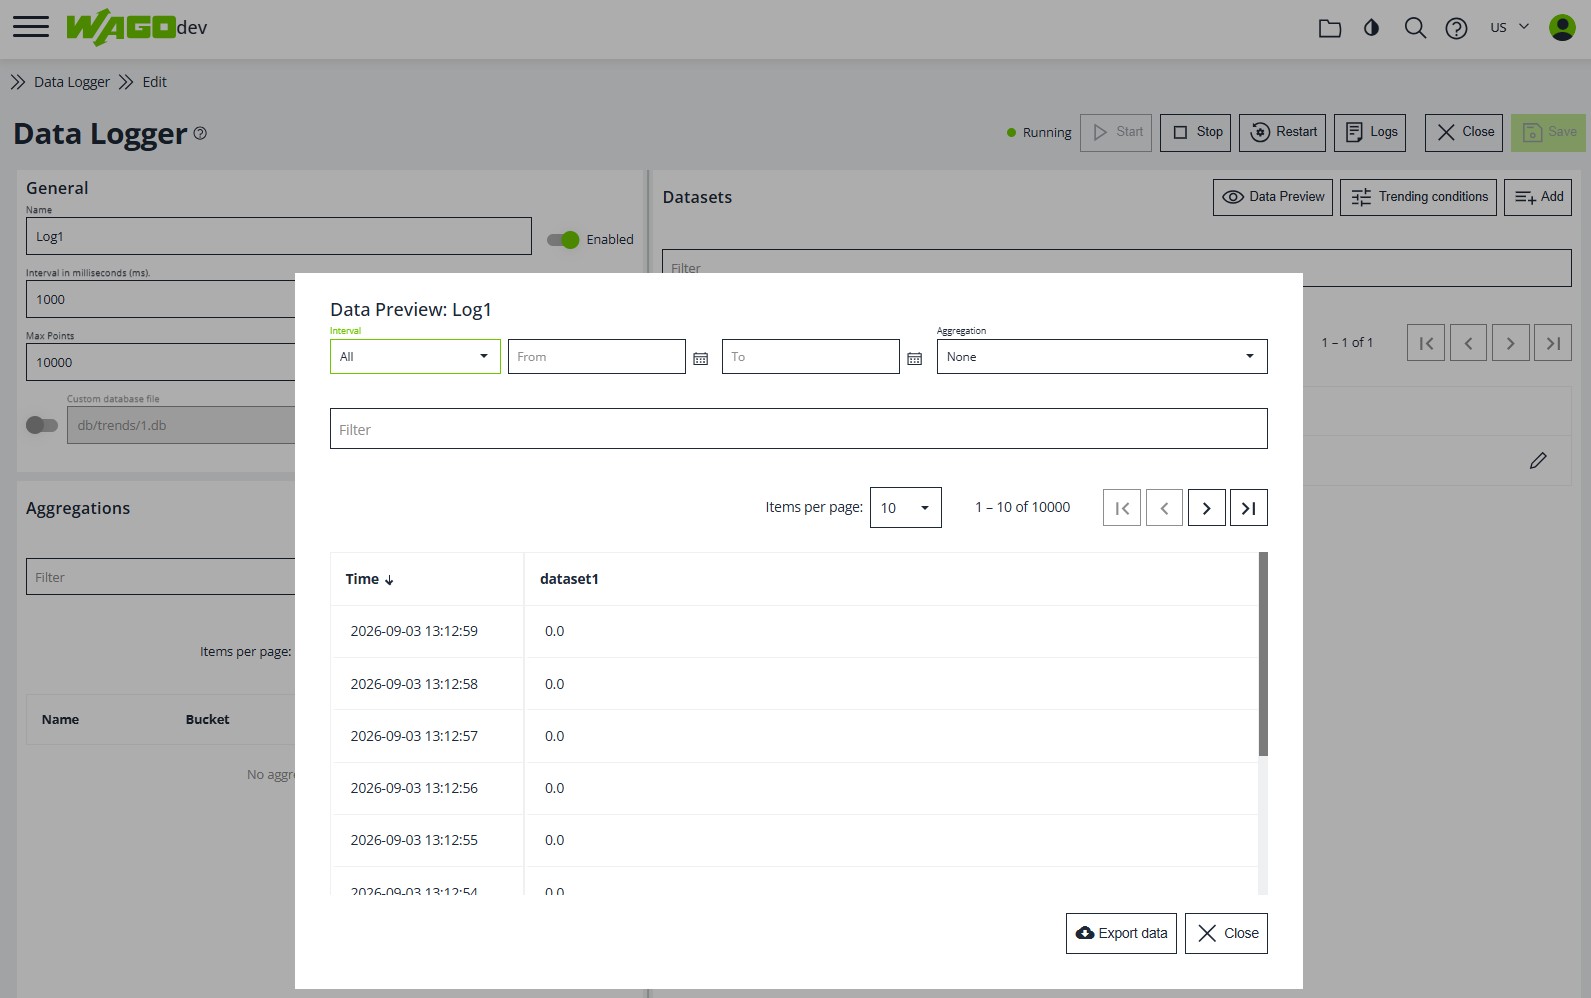
you can see the recorded records on the screen.
-
Select the Chart
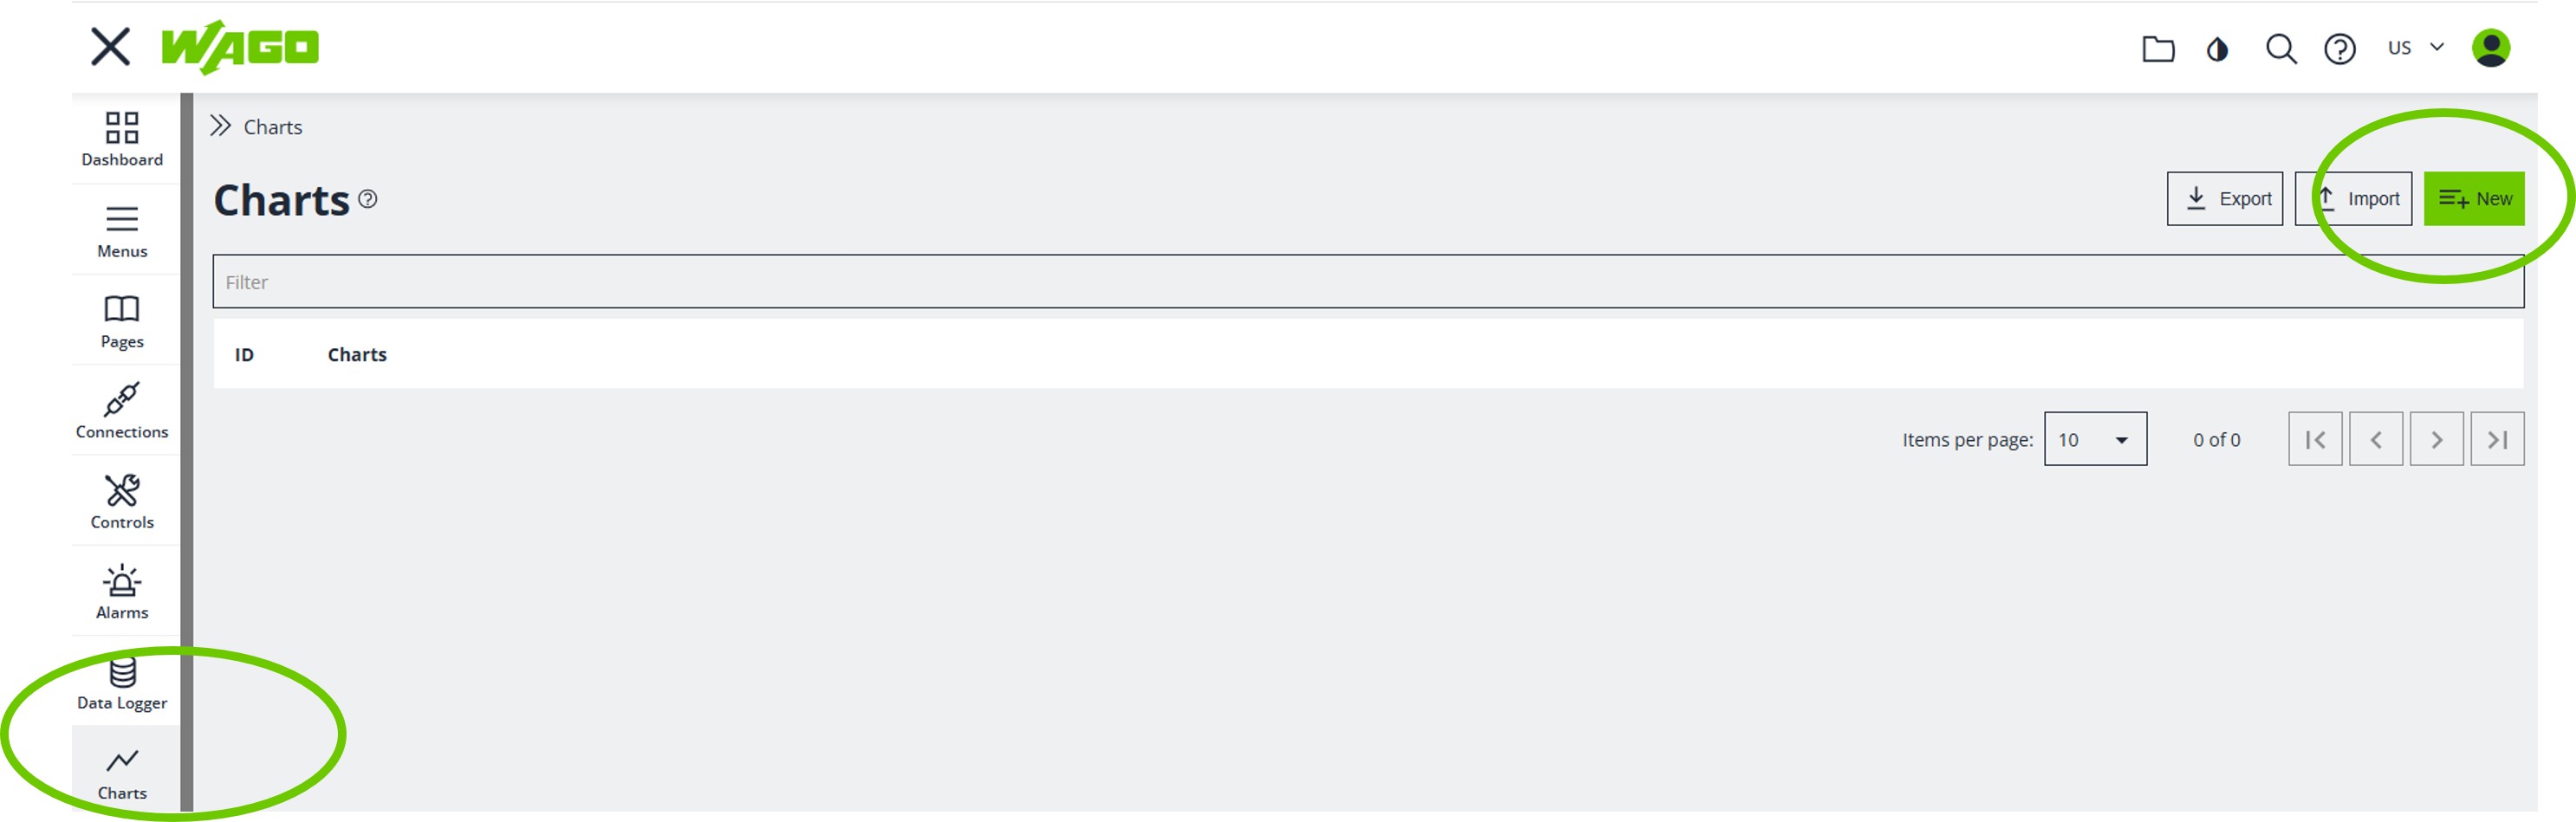
Press NEW -
Select the type of the chart, recoment : Line Graph
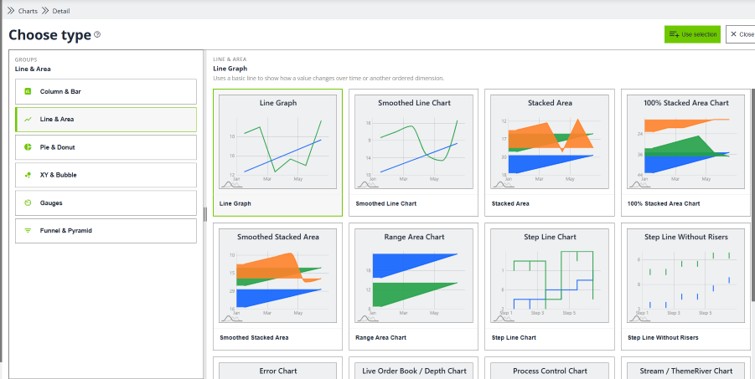
-
Select the Data Source
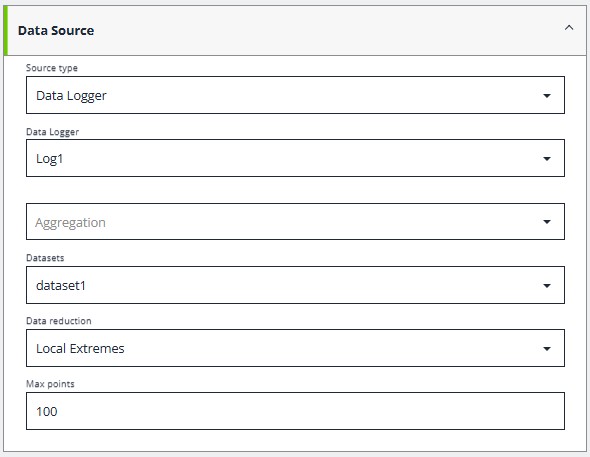
-
Set head datas an enable the refresh
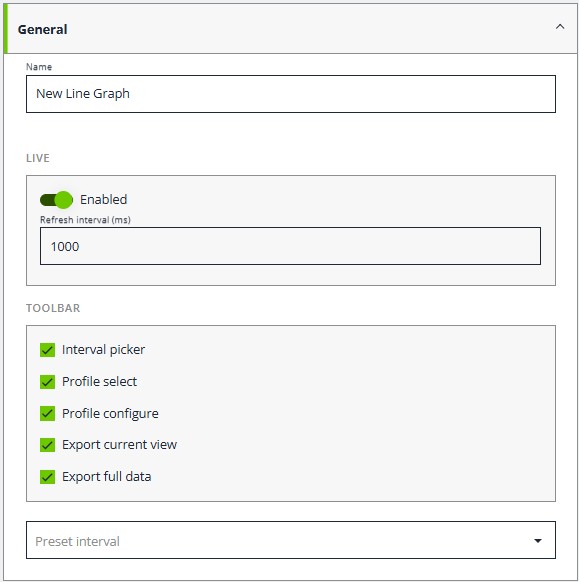
-
Set Zoom enable and scrollsbar and mini Preview
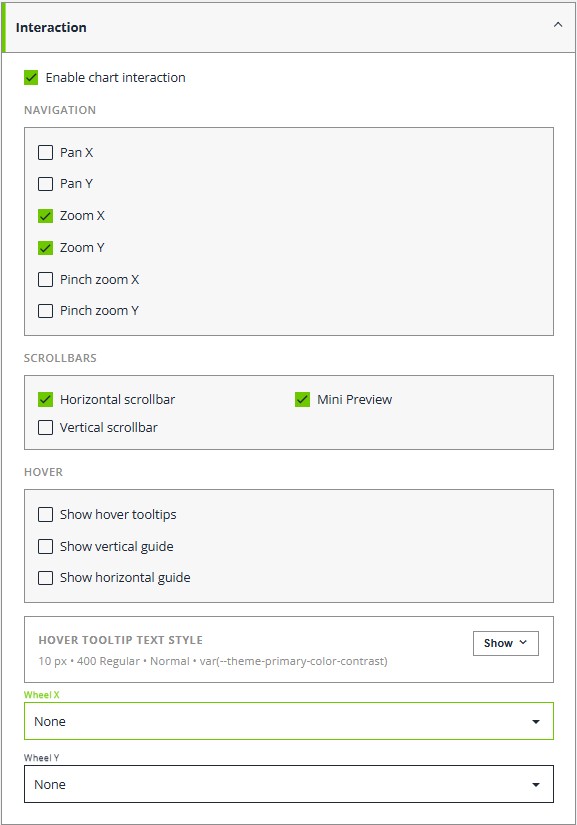
-
Bring the Chart object on the visu screen
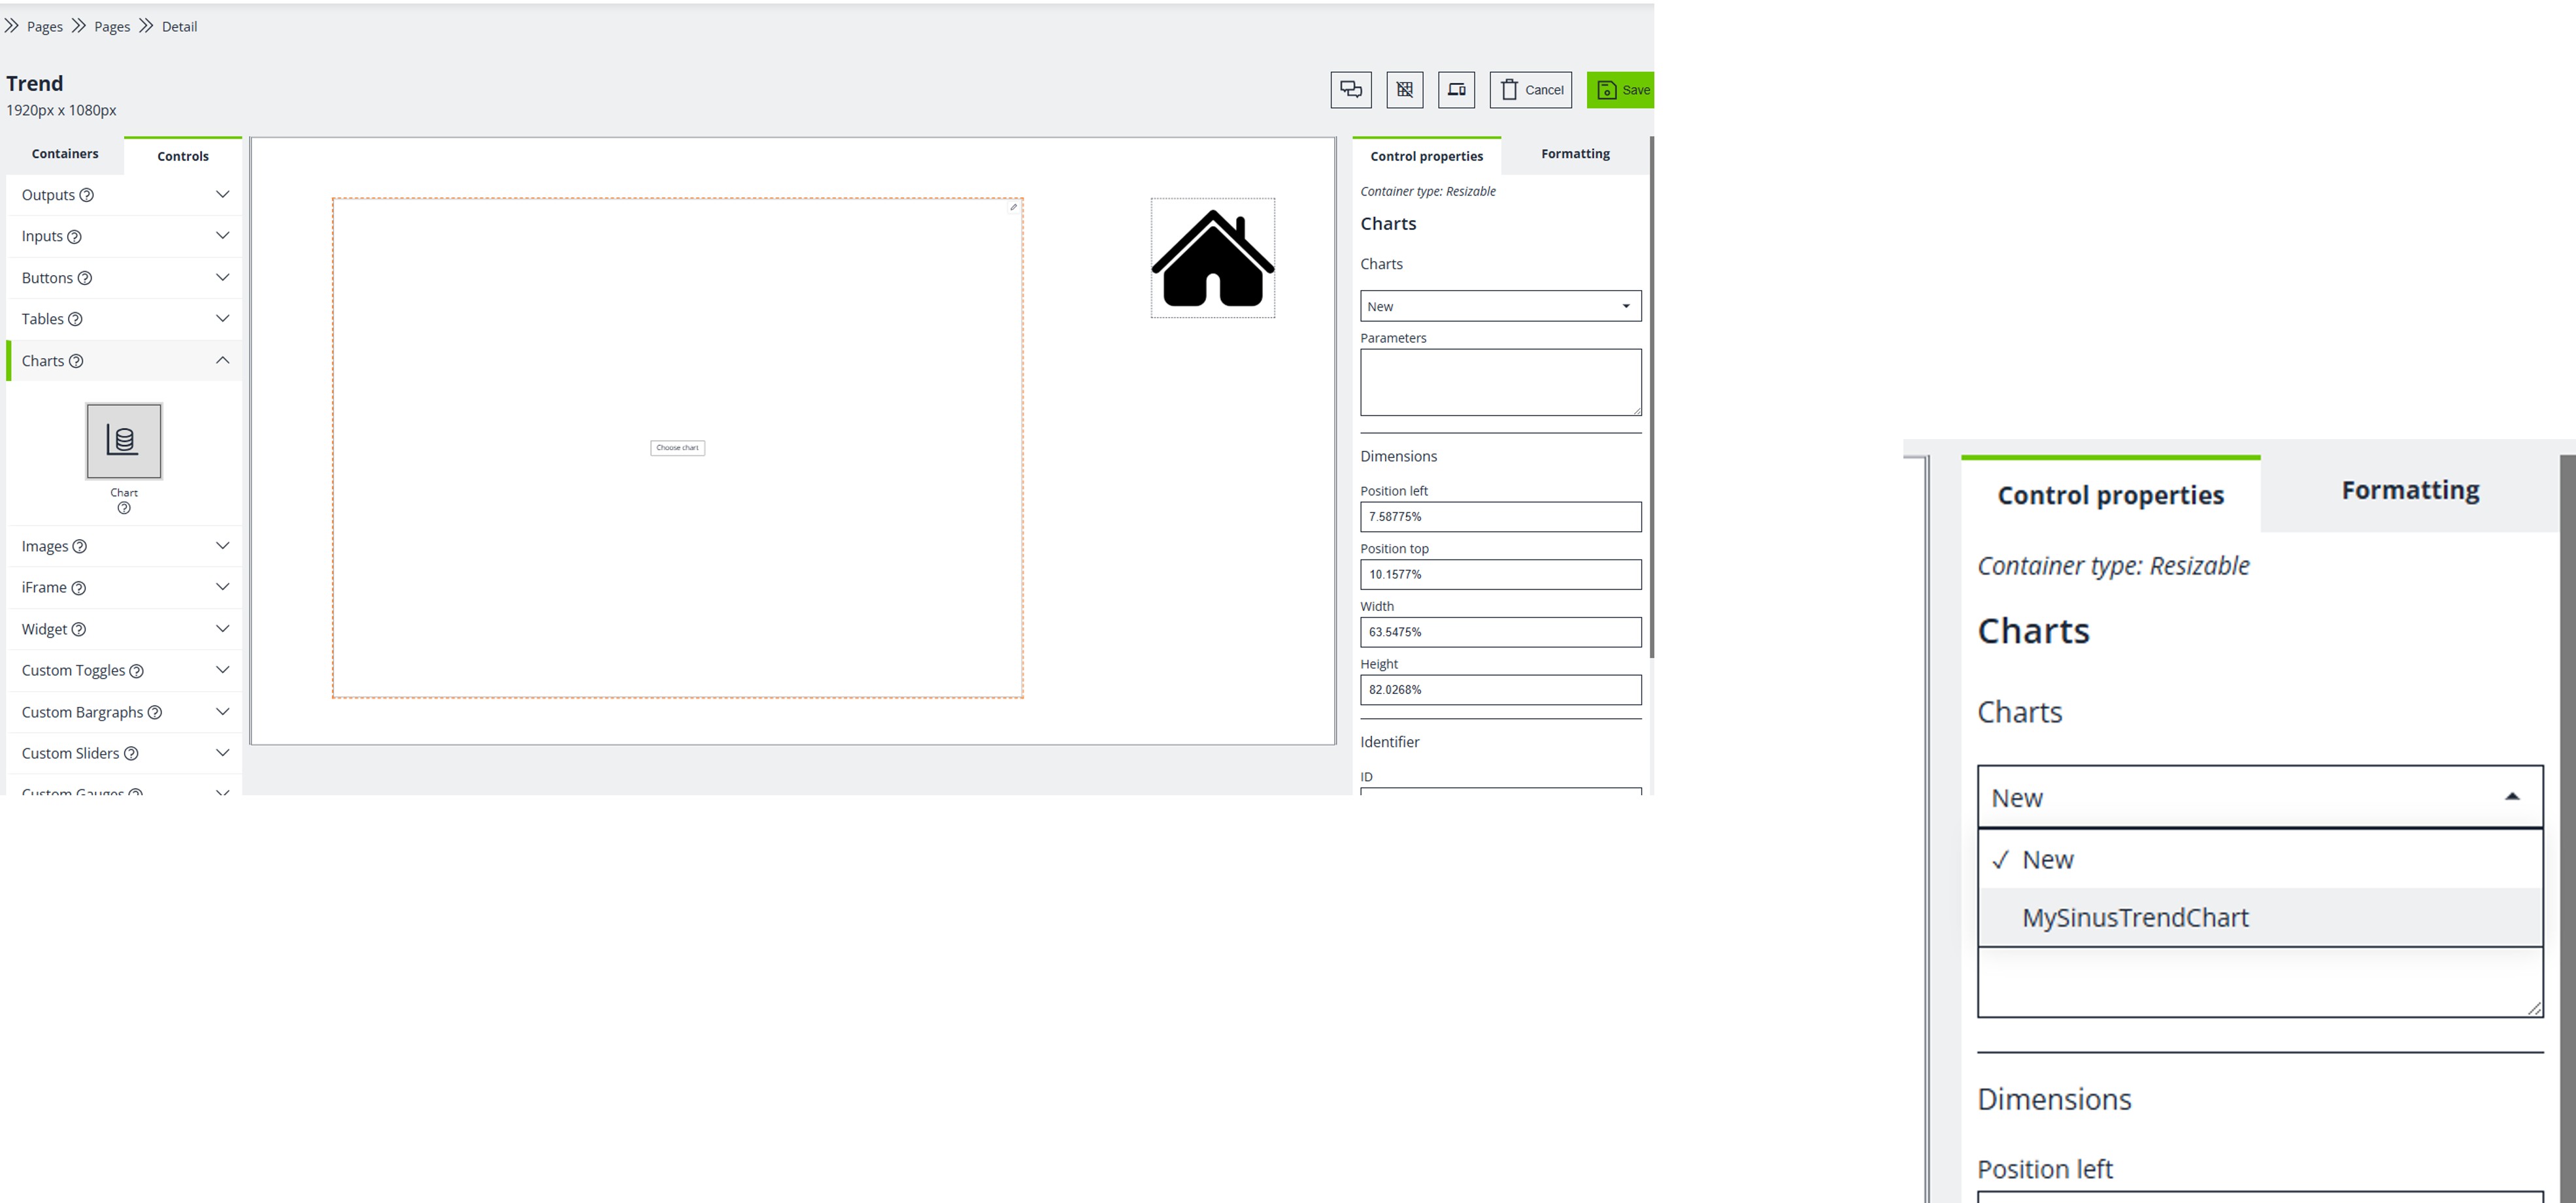
select the chart and with this icon
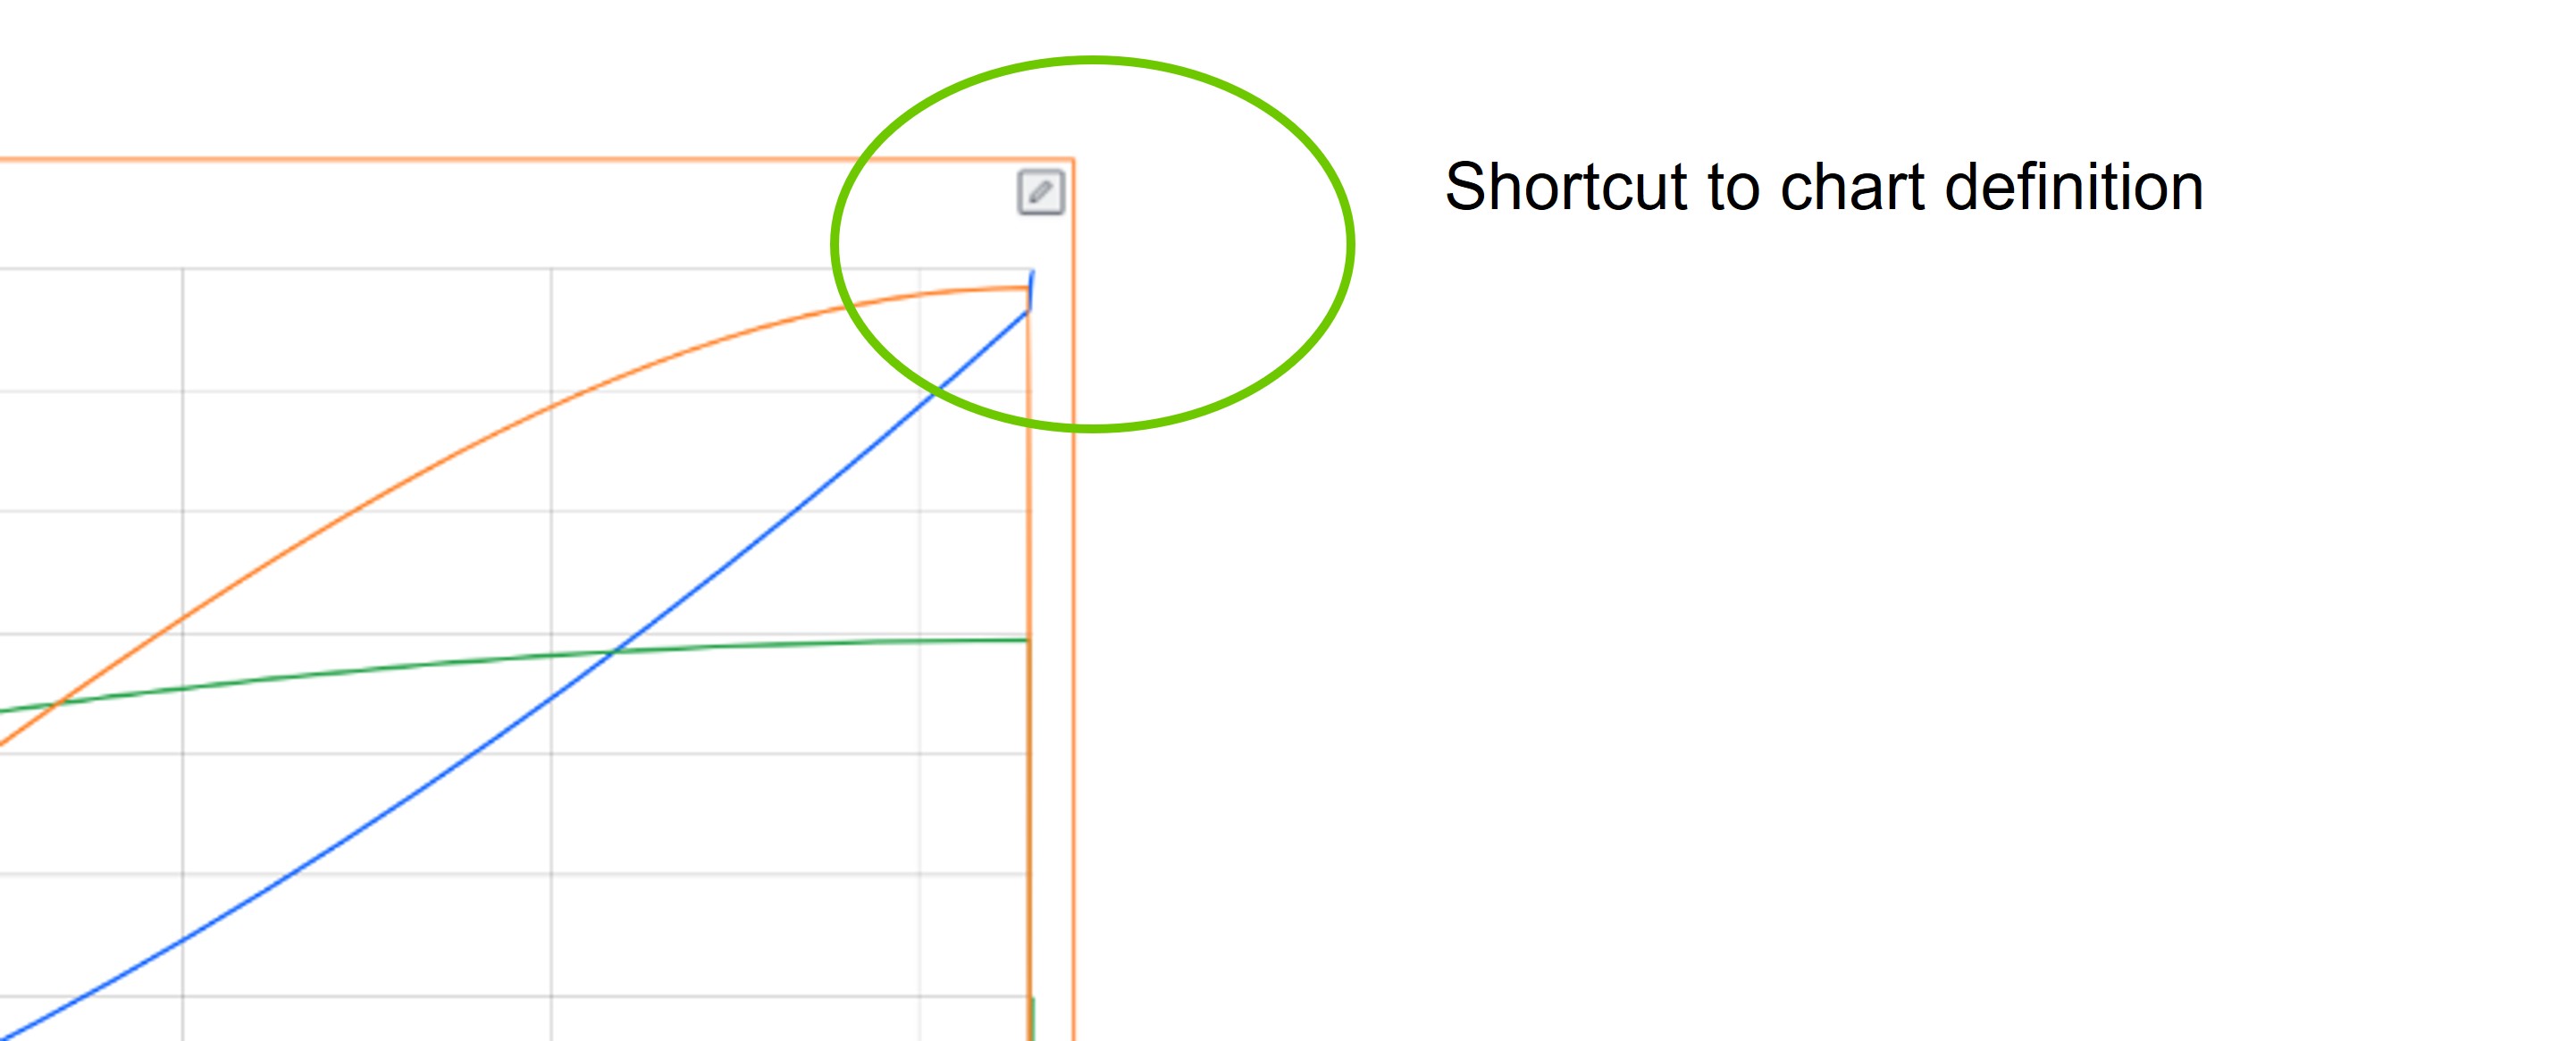
you can direct call the settings of the chart. -
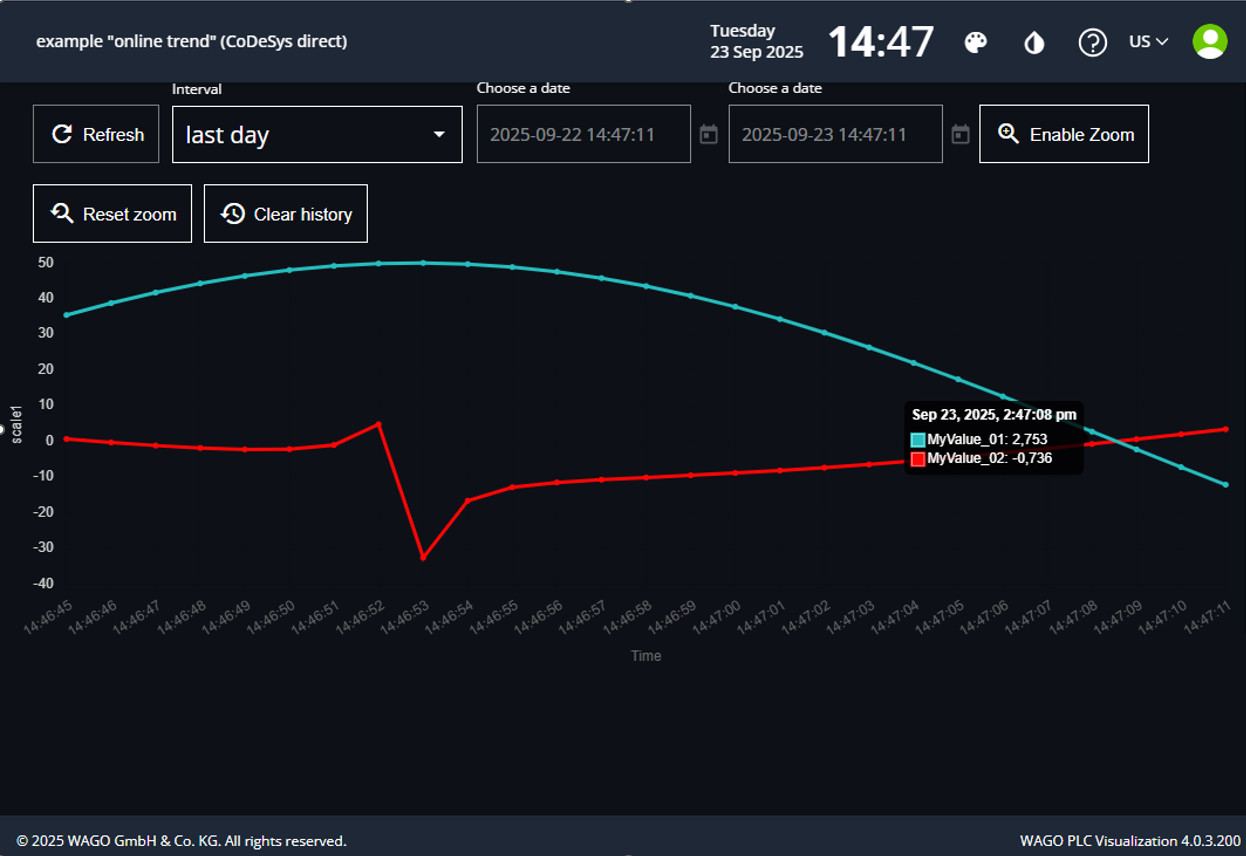
see the Chart in RUN mode
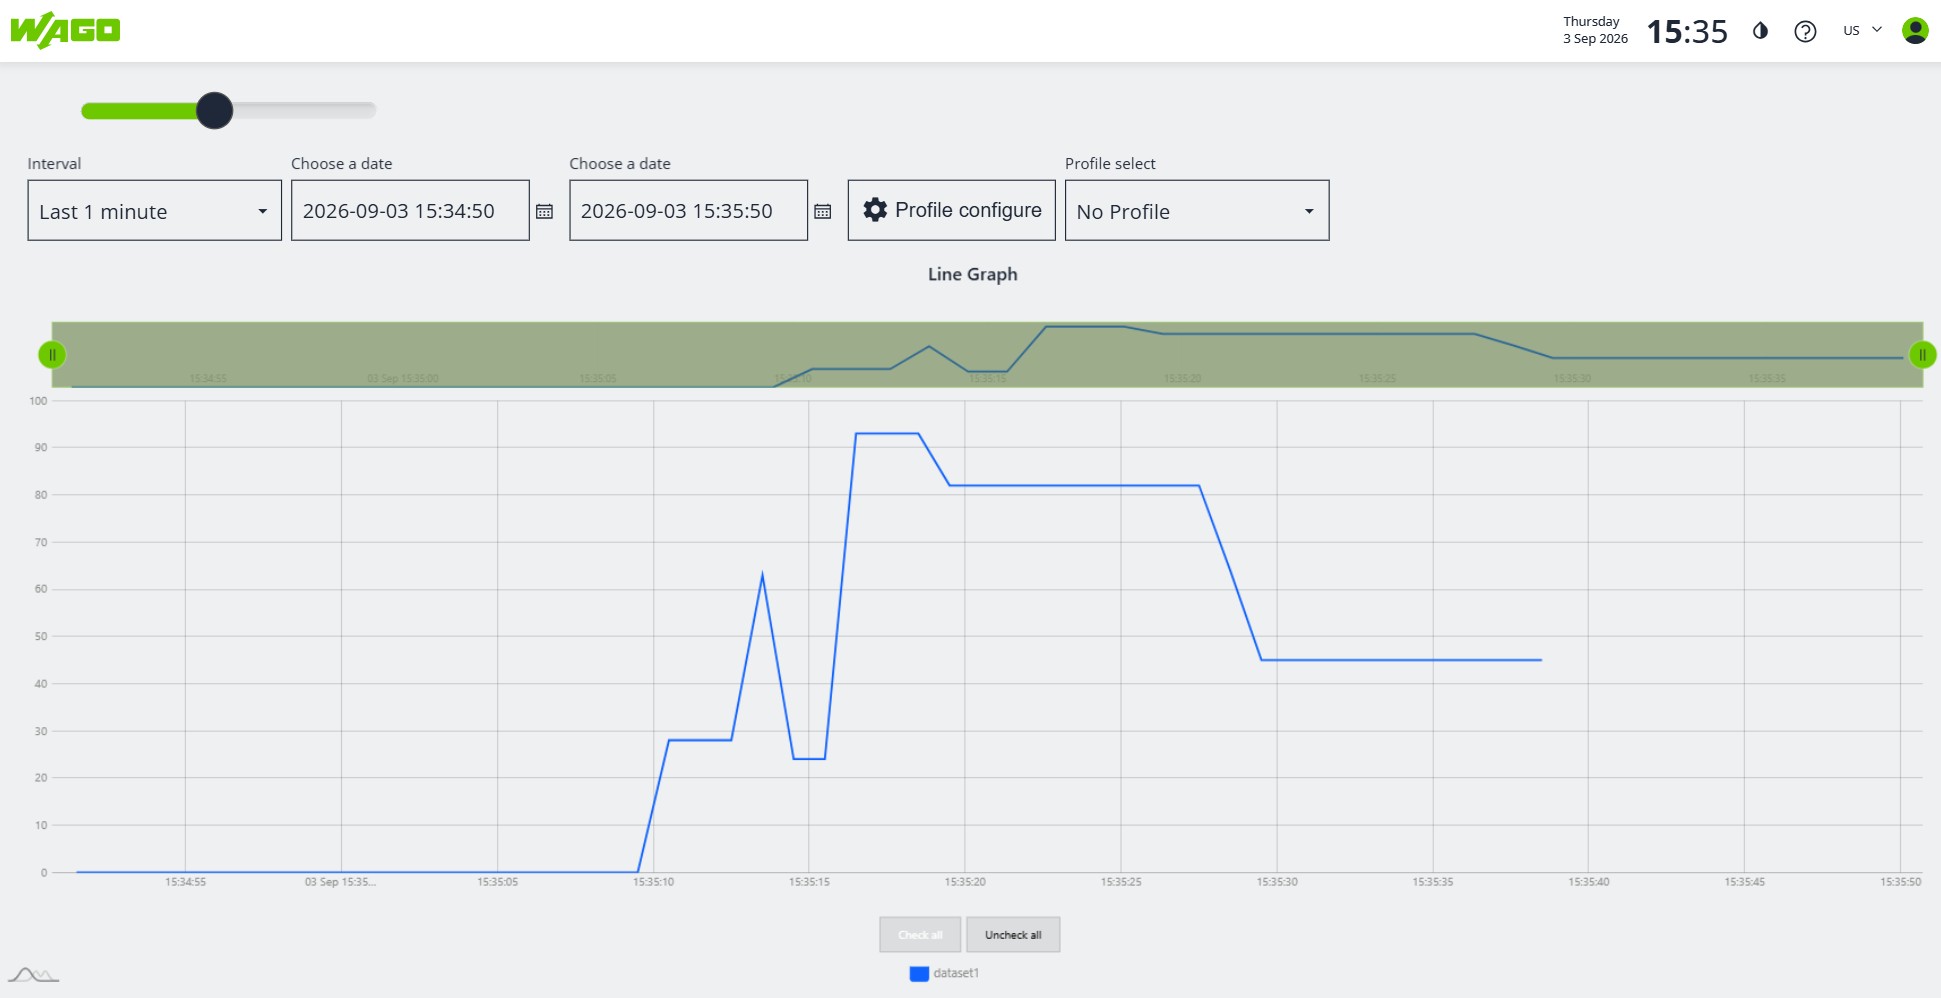
Chart with dynamic datas
Please follow the steps:
- Define the following struct in CODESYS
TYPE Turnover :
STRUCT
    January : REAL;
    February : REAL;
    March : REAL;
    April : REAL;
    May : REAL;
    June : REAL;
    July : REAL;
    August : REAL;
    September : REAL;
    October : REAL;
    November : REAL;
    December : REAL;
END_STRUCT
END_TYPE- Initalize the struct in CODESYS
VAR_OUTPUT
  Turnover2025          : Turnover := (January := 100, February := 110);
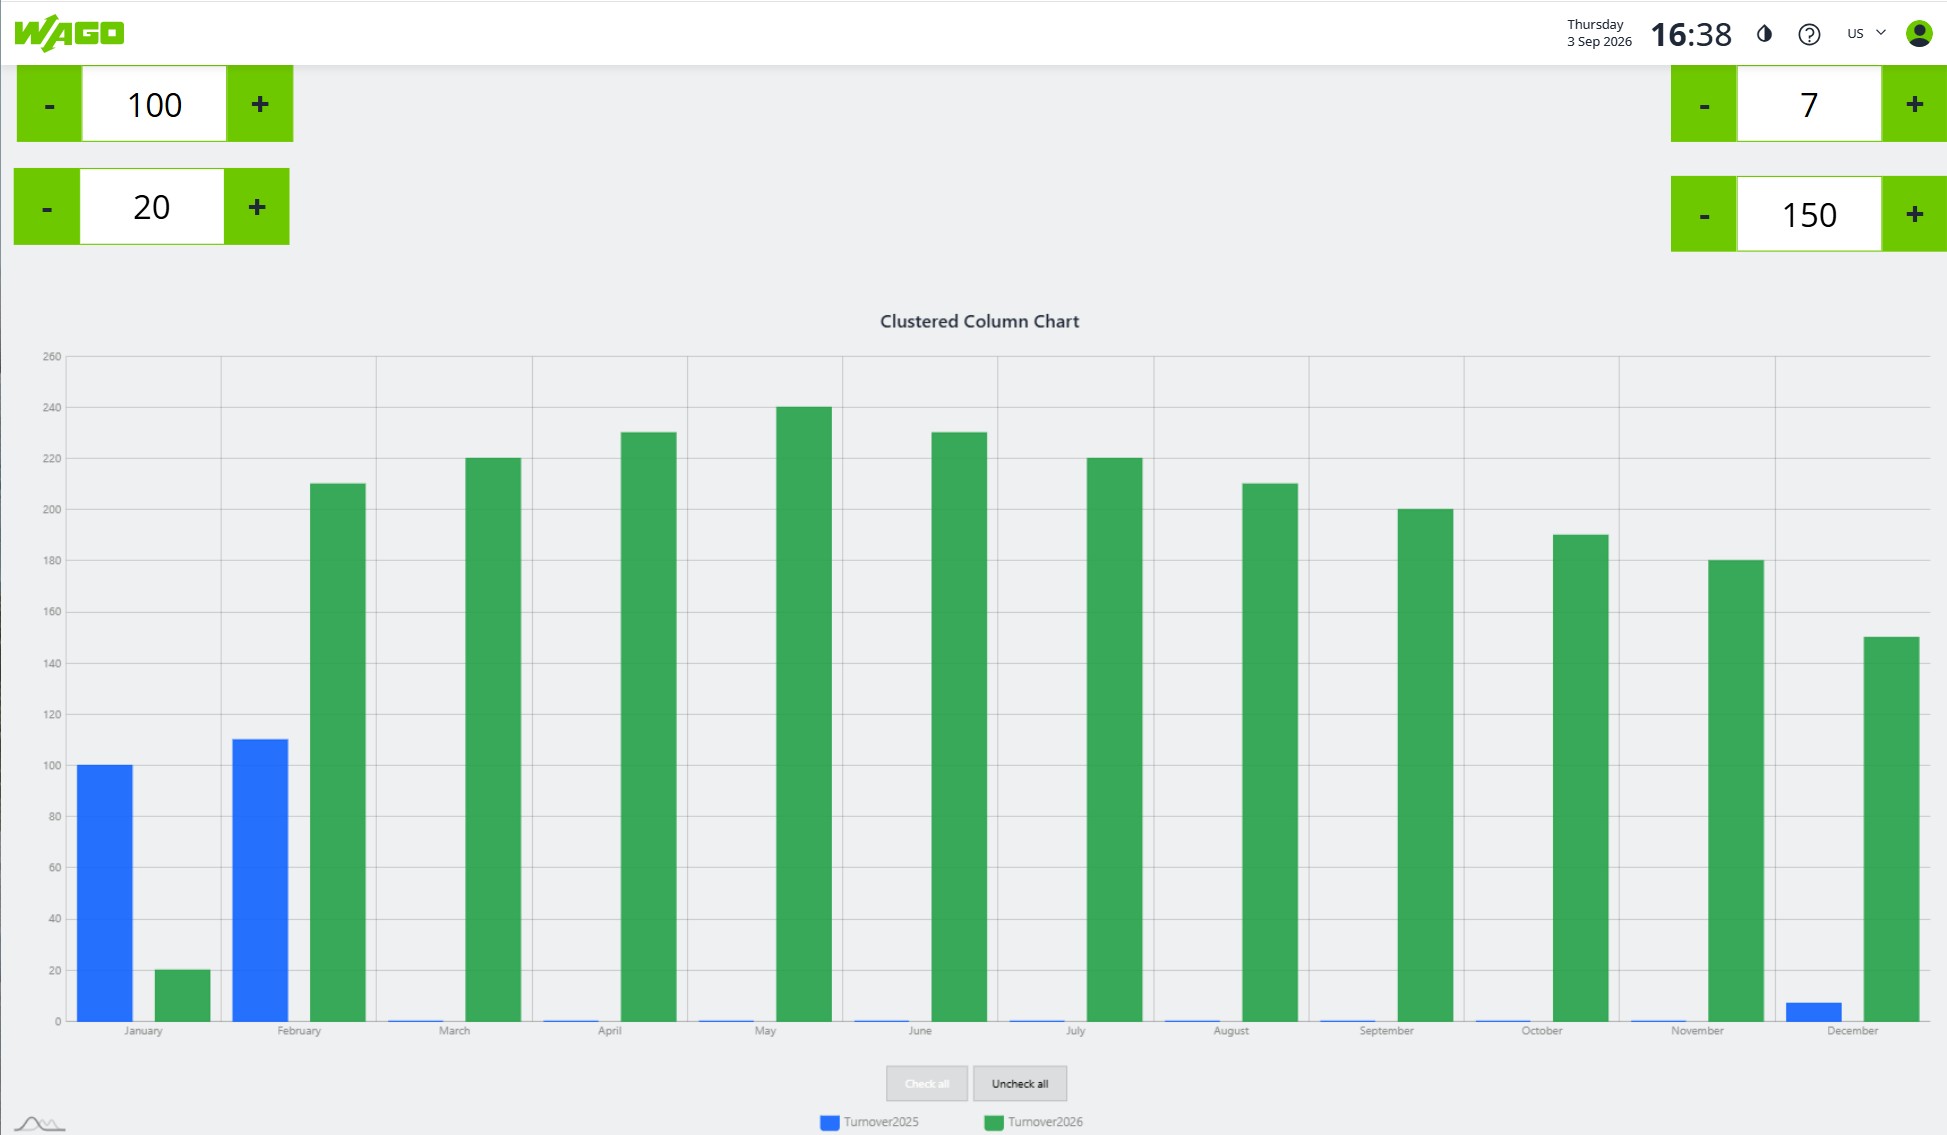
  Turnover2026          : Turnover := (January := 200, February := 210, March := 220, April := 230, May := 240, June := 230, July := 220, August := 210, September := 200, October := 190, November := 180, December := 150);
  i                     : int;
END_VAR
The Names of the struct element e.g. "January" appears automatic on the X-axis.
-
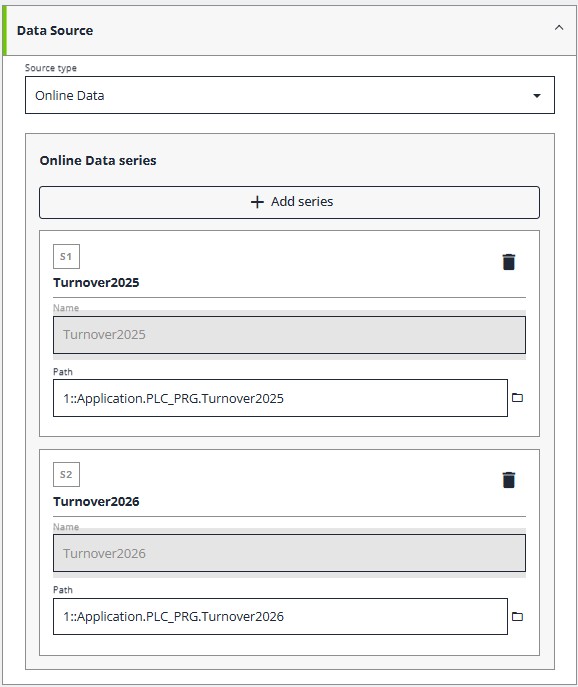
Data connection to Online Data with the right struct per each series
-
Bring the Chart object on the visu screen
-
see the Chart in RUN mode